by Luke Greiner
March 2014
Agriculture fueled the growth and economy during the first 100 years of America's independence. Just as agriculture jumpstarted the economic engine of our country, it had a substantial impact in Southwest Minnesota through the Great Recession. With some of the richest soil in the world it's no wonder that Minnesota was used as the backdrop for Laura Ingalls Wilder and Ole Rölvaag's portrayal of pioneer life on homestead farms. Agriculture pushed Minnesota from a Wild West frontier to a prosperous and suitable place to raise a family. This industry also shaped Minneapolis into Mill City with Duluth and Minneapolis becoming the largest wheat markets in the world and paving the way for the success of General Mills, Pillsbury, and many more.
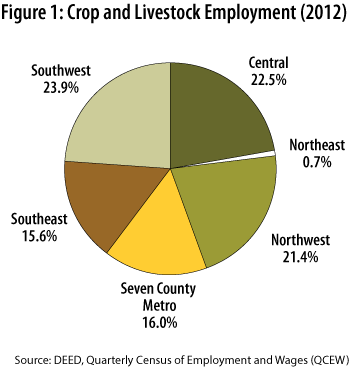
Southwest Minnesota is a hub of Agriculture in Minnesota employing a 23.9 percent majority of the Crop and Livestock workers in the state (Figure 1). In Southwest Minnesota Crop and Livestock employment accounted for 87 percent of all the occupations in the Agriculture, Forestry, Fishing, and Hunting (AFF) industry. Crop (NAICS 111) and Livestock (NAICS 112) employment totals 4,048 employees in Southwest Minnesota with the aggregate of all AFF employees totaling 4,657. The remaining 609 employees work within industries much less represented in term of employment. Six hundred four employees in the Crop industry are employed by 155 establishments, and 3,444 employees are employed by 293 Livestock establishments. The livestock industry represents 82 percent of the jobs in the Livestock and Crops Industries when combined. Crop and Livestock establishments comprise 81.8 percent of all establishments in NAICS 11 in Southwest Minnesota.
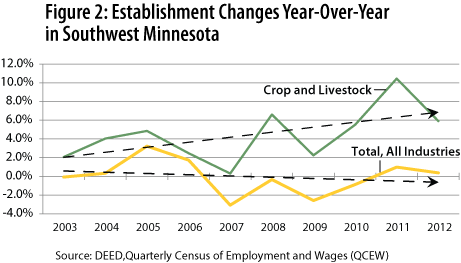
The region has a total of 12,256 establishments with 448 that employed Crop or Livestock workers in 2012. Even though they represent only 3.7 percent of all establishments, Crop and Livestock establishments have maintained an average year-over-year increase of 4.4 percent compared to a 0.0 percent growth rate for Total, All Industries from 2002-2012 (Figure 2). Southwest Minnesota had 291 Crop and Livestock establishments in 2002 and 448 in 2012, an increase of 54 percent. The total of all establishments in the area in 2002 totaled 12,314 establishments and had 12,256 in 2012, a decrease of .5%.
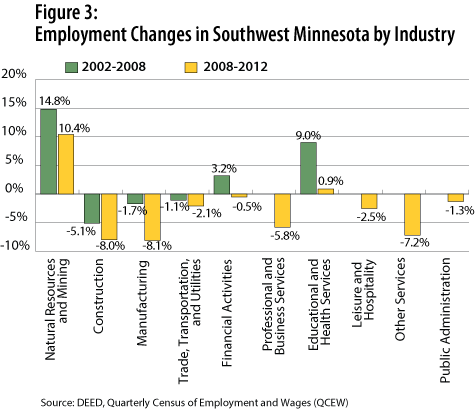
Changes in employment have favored the agriculture industry in Southwest Minnesota, as is clear in Figure 3, which has fared much better coming out of the recession, providing a stable anchor for the area in uncertain times. While the majority of industries have been contracting, the Agriculture industry in the Southwest is providing relief by expanding.
Southwest Minnesota was home to four of the top five counties in total agricultural sales in 2007 according to the USDA Economic Research Service. Renville, Martin, Redwood, and Nobles Counties ranked 2,3,4 and 5 in the state respectively (Stearns County being number one) in agricultural sales with combined receipts of $1,531,365,000, which was 11.7 percent of the state's $13.2 billion in combined receipts.
DEED's Quarterly Census of Employment and Wages (QCEW) generates data on establishments that are covered by the Unemployment Insurance Program. About 97 percent of Minnesota employment is covered by the Unemployment Insurance Program. Jobs and workers excluded from these statistics include sole proprietors, the self-employed, railroad employees, and family farm workers.
This is important because of the large number of family farms and small farm operations in Minnesota. A common misconception is that the number of farms in Minnesota is decreasing because smaller operations are being absorbed by larger operations, reducing the overall number of farmers and employees in the industry. According to the Minnesota Department of Agriculture the number of farms in Minnesota in 1992 was 75,000 and in 2011 it was 79,800. By comparison, the number of farms in Minnesota during World War II was 197,000. The mismatch between the number of farms in Minnesota and the establishments that hire Crop and Livestock workers is largely the result of the limitations of data collection by the QCEW and the UI Program. The vast majority (97.04 percent) of agricultural establishments in Minnesota are sole proprietors, family farms, and small partnerships that do not pay into the UI Program. According to the USDA a farm is defined as having $1,000 in annual agricultural sales. This has been consistent since 1974. There are no land or animal requirements to qualify as a farm, only agricultural sales. The number of farms has increased in the last couple of decades, but it's worth noting that higher commodity prices are also pushing small operations into the definition of a farm.
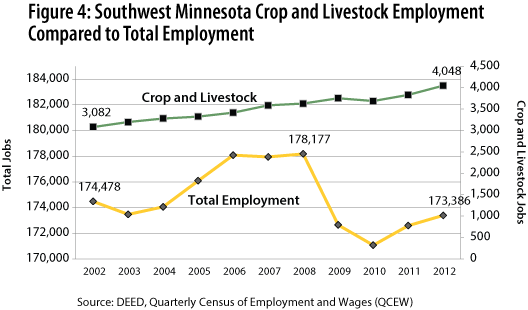
In 2012 in Southwest Minnesota there were 4,048 Crop and Livestock employees, part of the total employment figure in all industries of 173,386 (Figure 4). In the 10-year period from 2002 - 2012 Crop and Livestock held an average of 3,531 jobs per year and maintained an average year-over-year increase of 2.8 percent by adding 966 jobs. The average growth of employment in all industries in Southwest Minnesota for the 10-year time period was -0.1 percent with a loss of 1,092 jobs.
The recession started in December 2007 and ended 18 months later in June 2009 according to the National Bureau of Economic Research. Unlike most industries that contracted during the recession, Agriculture in Minnesota thrived. High commodity prices coupled with favorable growing conditions contributed to median farm incomes, increasing more than 70 percent in 2007, the most profitable year for Minnesota farmers since 1973.
Crop and Livestock employers added 167 jobs during the recession, averaging 3.2 percent employment growth. In the same period for all of Minnesota, Crop and Livestock added 363 jobs, a 1.8 percent job growth rate. The employment for All Industries in Southwest Minnesota contracted at a 1 percent rate during the depths of the recession costing 5,295 jobs. Crop and Livestock producers experienced virtually no hangover from the recession with only a single year of negative employment growth, 2010 at -1.8 percent.
Crop and Livestock employees have seen healthy gains in their wages in recent years. Average yearly wages in Southwest Minnesota have increased 35.8 percent from $25,740 in 2002 to $34,944 in 2012 with Crop and Livestock employees gaining 44.8 percent from $22,178 in 2002 to $32,110 in 2012. Crop and Livestock employers paid out $132,834,729 in UI-covered wages in 2012.
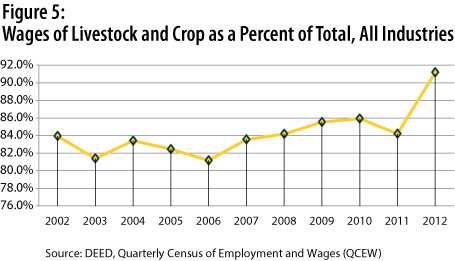
Wages for these workers have been historically lower than average, but the margin has been declining recently. In 2002 Crop and Livestock workers earned 83.9 percent of the average for all other employees in the area. By the time the recession came and went ag employees were earning 91.2 percent of the average of all other employees. From 2011 to 2012 the spread between average Crop and Livestock wages and the average for all other workers went from 3,562 to 2,834, a decline from a 15.8 percent difference to an 8.8 percent difference (Figure 5). This does not follow the normal changes from year to year, and a market correction could be possible in the future. Crop workers in Southwest Minnesota earn 17 cents more than the same workers in the rest of Minnesota and $2.02 higher than the national median. Median hourly wages for livestock workers are also higher than the state and national median with Southwest Minnesota employees making $1.76 and 20 cents more, respectively.
As the use of technology increases, so will the knowledge level required for the employees who work in the Agriculture industry. Many operations have sophisticated electronic monitoring systems in barns and highly accurate GPS systems onboard tractors. Knowing how to use these types of systems will require higher wages to attract more qualified employees. Another factor worth considering is the growth of wages in the Crop and Livestock industries from the commodity prices received by producers. From 2002 to 2012 the price received by producers of corn increased 313 percent, soybeans by 283 percent, hogs by 191 percent, beef cattle by 180 percent, and turkeys by 195 percent. Although these gains are substantial this is not a complete representation of income changes because input prices have also risen dramatically. It does, however, provide some context for the rapid changes being experienced in Agriculture since 2002.
Southwest Minnesota will benefit greatly from the growth predicted in the Crop and Livestock industry, much faster growth than the same industry statewide. State employment from the Crop and Livestock industry is expected to have a net gain of 686 jobs from 2010-2020 while Southwest Minnesota is expecting a net gain of 823, a 20 percent increase over the state as a whole (Table 1). Not only will Crop and Livestock establishments hire at a faster rate in the Southwest than every other area, but it will also eclipse the employment growth projected for the total of all industries in Southwest Minnesota by 62.5 percent.
| Planning Area | NAICS Industry Title (Code) | Estimated Employment 2010 | Projected Employment 2020 | Percent Change 2010 – 2020 | Numeric Change 2010 - 2020 |
|---|---|---|---|---|---|
| Minnesota | Crop and Animal Production (111,112) | 20,514 | 21,200 | 3.30% | 686 |
| Southwest Minnesota | Total, All Industries (0) | 206,339 | 227,716 | 10.40% | 21,377 |
| Southwest Minnesota | Crop and Animal Production (111,112) | 4,881 | 5,704 | 16.90% | 823 |
| Source: DEED, 2010 to 2020 Employment Projections | |||||
Southwest Minnesota is expected to gain the most employees in the Crop and Livestock industry by a large margin over the other five Planning Areas which are projected to experience negative growth in the industry. By 2020 Central Minnesota is projected to lose the largest amount of Crop and Livestock employment: a 102 drop in crops and 184 in livestock. The next fastest growth in these two sectors comes from Southeast Minnesota with projected gains of 326 in Livestock and from the seven-county Metro Area a gain of 72 in Crops. These projections ensure that the Crop and Livestock industries and their workers will remain important in Southwest Minnesota for years to come.
A Condensed History of Minnesota Agriculture 1858-2008. (2008).
Minnesota Department of Agriculture, (2011). 2011 state agriculture overview.
U.S. Department of Agriculture, National Agricultural Statistics Survey. (2014).
U.S. Department of Agriculture, Economic Research Service (2014).
U.S. Department of Agriculture, National Agricultural Statistics Survey, (2013) Farms, Land in Farms, and Livestock Operations 2012 Summary.