By Tim O'Neill
May 2018

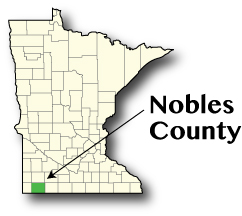
This month of County Snapshots starts us off in the extreme southwest corner of Minnesota with Nobles County. Bordered by Rock, Pipestone, Murray, Cottonwood, and Jackson counties, Nobles County also shares its southern border with Iowa. The county was named for William H. Nobles, a member of the Territorial Legislature.
Nobles County was first occupied by the Sisseton Indians, with new settlers first coming to the area in 1842. Organized in 1849, Nobles County was officially created by the Minnesota Legislature in May, 1857. It wasn't until 1870, however, that a county government was set up. One year later, in 1871, the first railroad, which traveled through Worthington, was built. Soon afterwards, the county's population began to boom. Between 1870 and 1900, the county's population skyrocketed by 12,662 percent (yes, that much), essentially going from non-existent to 15,000 people over 30 years. Over the next 70 years, the county added an additional 8,300 people, before contracting by 3,100 people through 1990. Between 1990 and 2016, Nobles County's population resumed growing, albeit at a much more gradual pace.
Nobles County's largest city and the county seat is Worthington, with 13,136 people, Adrian being the only other city with more than 1,000 people. Altogether, just over 77 percent of the county's total population live within one of 11 cities The remaining residents make their homes within the county's 20 townships.
As of annual 2017, Nobles County had 614 establishments supplying 10,451 jobs. 63.1 percent of these jobs were in Manufacturing, Educational and Health Services, and Retail Trade. Within the past five years, between 2012 and 2017, most employment growth was in Manufacturing, Financial Activities, Educational and Health services, and Agriculture. Nobles County's total employment has fluctuated quite a bit since 2000. For example, between 2002 and 2006, the county gained about 530 jobs. After no change between 2006 and 2009, the county lost about 300 jobs between 2009 and 2013. Since 2013, the county has regained those 300 jobs, growing by an annual average of 0.7 percent during that time.
According to the U.S. Census of Agriculture, Nobles County had 995 farms in 2012, with an average farm size of 382 acres. With the market value of products sold approaching $478 million in 2012, the county is especially known for cattle, hogs and pigs, corn for silage, and soybeans.
| Economy | ||
|---|---|---|
| Estimates | Nobles County | Minnesota |
| Population | 21,848 | 5,519,952 |
| Labor Force | 11,386 | 3,100,406 |
| Average Unemployment | 3.3% (374 people) | 3.8% (117,059 people) |
| Per Capita Income | $24,188 | $33,225 |
| Cost of Living, Individual | $25,891 ($12.45 per hour) | $31,656 ($15.22 per hour) |
| Cost of Living, Average Family | $44,214 ($14.17 per hour) | $57,624 ($18.47 per hour) |
| Source: DEED Local Area Unemployment Statistics March 2018; DEED Cost of Living in Minnesota 2018; U.S. Census Bureau, 2016 American Community Survey Estimates: | ||
| Industry | |||||
|---|---|---|---|---|---|
| Top Industries of Employment | 2017 Annual Data | 2012 – 2017 Percent Change | |||
| Number of Firms | Number of Jobs | Average Wage | Employment | Average Wage | |
| Total, All Industries | 614 | 10,451 | $41,600 | 265 (2.6%) | 18.5% |
| Manufacturing | 33 | 3,008 | $52,312 | 183 (6.5%) | 15.9% |
| Educational and Health Services | 64 | 2,222 | $42,016 | 141 (6.8%) | 20.4% |
| Trade, Transportation, and Utilities | 170 | 2,156 | $32,916 | -204 (-8.6%) | 7.5% |
| Leisure and Hospitality | 43 | 612 | $14,768 | -184 (-23.1%) | 33.3% |
| Source: DEED Quarterly Census of Employment and Wages (QCEW) | |||||

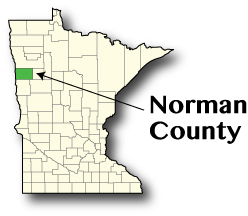
With 1,629 people, Ada is Norman County's largest city and also the county seat. Other larger cities include Twin Valley (784 people), Halstad (568 people), and Hendrum (298 people). Altogether, Norman County's eight cities account for just about 60 percent of the county's total population of 6,579 people. The remaining 40 percent reside in the county's 24 townships, with Wild Rice Township being the largest (334 people). Flom, Fossum, McDonaldsville, and Home Lake townships all have over 180 people.
Norman County was organized in February, 1881. In 1890 the county had an estimated population of 10,618 people. Over the next decade the population spiked by nearly 42 percent, reaching just over 15,000 people. Through the 1940s the county's population swayed back and forth, essentially staying around 14,400 people. Since 1940, however, the county's population has been in continuous decline. Between 1940 and 2010, Norman County's total population declined by about 54 percent or nearly 7,900 people. Population loss has started to level off recently, with just 273 people exiting between 2010 and 2016.
As of 2017 Norman County had 236 establishments supplying 1,694 jobs. Over one-third of these jobs, 36.5 percent, were in Educational and Health Services with 383 jobs in Health Care and Social Assistance and 234 jobs in Educational Services. Other industries with significant employment in Norman County include Public Administration (189 jobs), Retail Trade (188 jobs), and Agriculture (148 jobs). Total employment in Norman County has been steadily declining since the turn of the century. More specifically, between 2000 and 2017, the county shed 362 jobs, declining by 17.6 percent. In recent years, between 2015 and 2017, total employment bumped up slightly by 2.5 percent or approximately 40 jobs.
Mention should also be made of Norman County's agriculture, especially because of the rich soil of the Red River Valley. According to the U.S. Census of Agriculture, the county had 610 farms in 2012, with an average farm size of 873 acres. With the market value of products sold north of $281 million in 2012, the county is especially known for soybeans, spring wheat, and sugar beets.
| Economy | ||
|---|---|---|
| Estimates | Norman County | Minnesota |
| Population | 6,579 | 5,519,952 |
| Labor Force | 3,352 | 3,100,406 |
| Average Unemployment | 5.9% (197 people) | 3.8% (117,059 people) |
| Per Capita Income | $26,270 | $33,225 |
| Cost of Living, Individual | $27,464 ($13.20 per hour) | $31,656 ($15.22 per hour) |
| Cost of Living, Average Family | $46,703 ($14.97 per hour) | $57,624 ($18.47 per hour) |
| Source: DEED Local Area Unemployment Statistics March 2018; DEED Cost of Living in Minnesota 2018; U.S. Census Bureau, 2016 American Community Survey Estimates | ||
| Industry | |||||
|---|---|---|---|---|---|
| Top Industries of Employment | 2017 Annual Data | 2012 – 2017 Percent Change | |||
| Number of Firms | Number of Jobs | Average Wage | Employment | Average Wage | |
| Total, All Industries | 236 | 1,694 | $36,764 | -47 (-2.7%) | 16.3% |
| Educational and Health Services | 28 | 618 | $35,776 | 24 (4.0%) | 15.8% |
| Trade, Transportation, and Utilities | 67 | 364 | $36,504 | -26 (-6.7%) | 3.2% |
| Public Administration | 11 | 189 | $32,084 | +1 (0.5%) | 24.1% |
| Natural Resources and Mining | 42 | 148 | $39,104 | 22 (17.5%) | 20.4% |
| Source: DEED Quarterly Census of Employment and Wages (QCEW) | |||||

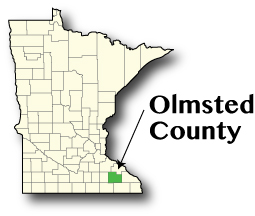
Passing along U.S. Highways 52, 14, or 63 one is bound to come to the City of Rochester, the county seat. With a population of over 114,000 people, Rochester is Olmsted County's most populous city and Minnesota's third most populous city. Rochester is well known for being home to the Mayo Clinic, recently ranked first on the U.S. News & World Report's list of "Best Hospitals in the United States."2 Olmsted County's other cities include Stewartville, Byron, Pine Island (partly), Chatfield (partly), Eyota, Oronoco, and Dover.
As of 2017 Olmsted County had 3,412 establishments supplying 97,295 jobs. Over half of these jobs, 51.3 percent, were in Educational and Health Services with 44,246 jobs in Health Care and Social Assistance and 5,487 jobs in Educational Services. Other industries with significant employment in Olmsted County include Retail Trade (10,463 jobs), Accommodation and Food Services (7,935 jobs), and Manufacturing (6,666 jobs). Within Manufacturing, Olmsted County is especially known for Computer and Electronic Product Manufacturing (2,780 jobs) and Food Manufacturing (1,665 jobs). The county is also home to an estimated 1,150 farms.
Total employment in Olmsted County has been steadily increasing since the end of the Great Recession in 2010. More specifically, the county gained over 9,970 jobs between 2010 and 2017, growing by 11.4 percent. This increase was on pace with statewide growth during that period of time, which was 11.3 percent.
| Economy | ||
|---|---|---|
| Estimates | Olmsted County | Minnesota |
| Population | 153,102 | 5,519,952 |
| Labor Force | 86,640 | 3,100,406 |
| Average Unemployment | 3.0% (2,601 people) | 3.8% (117,059 people) |
| Per Capita Income | $36,143 | $33,225 |
| Cost of Living, Individual | $29,182 ($14.03 per hour) | $31,656 ($15.22 per hour) |
| Cost of Living, Average Family | $52,803 ($16.92 per hour) | $57,624 ($18.47 per hour) |
| Source: DEED Local Area Unemployment Statistics March 2018; DEED Cost of Living in Minnesota 2018; U.S. Census Bureau, 2016 American Community Survey Estimates | ||
| Industry | |||||
|---|---|---|---|---|---|
| Top Industries of Employment | 2017 Annual Data | 2012 – 2017 Percent Change | |||
| Number of Firms | Number of Jobs | Average Wage | Employment | Average Wage | |
| Total, All Industries | 3,412 | 97,295 | $59,800 | 6,275 (6.9%) | 14.1% |
| Educational and Health Services | 411 | 49,867 | $73,944 | 4,862 (10.8%) | 14.3% |
| Trade, Transportation, and Utilities | 742 | 13,953 | $32,500 | 241 (1.8%) | 11.0% |
| Leisure and Hospitality | 400 | 8,930 | $19,344 | 947 (11.9%) | 24.0% |
| Manufacturing | 107 | 6,666 | $80,444 | -1,109 (-14.3%) | 9.3% |
| Source: DEED Quarterly Census of Employment and Wages (QCEW) | |||||
1History of Olmsted County, County of Olmsted.
2U.S. News Hospitals Rankings and Ratings, U.S. News & World Report. Accessed May 14, 2018.

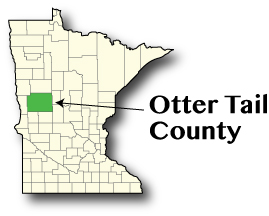
Otter Tail County has more than 1,000 lakes, more lakes than any other single county in the United States, among them five Round Lakes, 12 Long Lakes, 13 Mud Lakes, and, of course, Otter Tail Lake. NOTE: the county is spelled as two words, the city as one.
As with Olmsted County, Otter Tail County was originally home to the Dakota and Ojibwa. French and English fur traders began exploring the area more and more in the 19th century, with trading posts established on Leaf Lake and Otter Tail Lake. Otter Tail County was officially established in March, 1858. Shortly thereafter, the County's population exploded, going from 240 people in 1860 to 45,375 people in 1900.1
For most of the 20th century Otter Tail County's population remained largely unchanged. After rising gradually through 1940, the population decreased slightly through 1970. Between 1900 and 1970 the county's population only increased by 1.6 percent or just over 700 people. Since 1970, however, the county's population has grown by 26.0 percent, adding about 12,000 people. The word on all of the lakes in the area must have gotten out.
As of 2017 Otter Tail County had 1,752 establishments supplying 23,002 jobs. Health Care and Social Assistance is Otter Tail County's largest-employing industry with 4,578 jobs. Manufacturing, with 4,260 jobs, and Retail Trade, with 2,748 jobs, round out the county's top-three employing industries.
After losing 664 jobs (3.0 percent) between 2008 and 2009, Otter Tail County's total employment has increased at an average annual rate of 1.0 percent through 2017. This is equivalent to more than 1,700 jobs gained between 2009 and 2017. Within the last year of available data, between 2016 and 2017, the county added over 430 jobs, growing by 1.9 percent. Recently employment growth in Otter Tail County has been led by Manufacturing, Educational Services, Health Care and Social Assistance, Construction, and Administrative and Support Services.
| Economy | ||
|---|---|---|
| Estimates | Otter Tail County | Minnesota |
| Population | 58,085 | 5,519,952 |
| Labor Force | 32,207 | 3,100,406 |
| Average Unemployment | 5.2% (1,676 people) | 3.8% (117,059 people) |
| Per Capita Income | $28,781 | $33,225 |
| Cost of Living, Individual | $27,589 ($13.26 per hour) | $31,656 ($15.22 per hour) |
| Cost of Living, Average Family | $46,600 ($14.94 per hour) | $57,624 ($18.47 per hour) |
| Source: DEED Local Area Unemployment Statistics March 2018; DEED Cost of Living in Minnesota 2018; U.S. Census Bureau, 2016 American Community Survey Estimates | ||
| Industry | |||||
|---|---|---|---|---|---|
| Top Industries of Employment | 2017 Annual Data | 2012 – 2017 Percent Change | |||
| Number of Firms | Number of Jobs | Average Wage | Employment | Average Wage | |
| Total, All Industries | 1,752 | 23,002 | $38,480 | 1,122 (5.1%) | 16.7% |
| Educational and Health Services | 199 | 6,208 | $39,104 | 225 (3.8%) | 14.8% |
| Trade, Transportation, and Utilities | 387 | 4,470 | $37,076 | -82 (-1.8%) | 16.5% |
| Manufacturing | 94 | 4,260 | $46,228 | 472 (12.5%) | 18.5% |
| Leisure and Hospitality | 192 | 2,176 | $14,664 | 61 (2.9%) | 27.0% |
| Source: DEED Quarterly Census of Employment and Wages (QCEW) | |||||
1"History and Settlement," County of Otter Tail. Accessed May 14, 2018.