by Tim O'Neill
December 2023
The Minnesota Department of Employment and Economic Development (DEED) has several tools and resources that focus on occupational data. Users of DEED's Occupational Employment and Wage Statistics (OEWS) can discover estimated employment and wage percentiles for over 800 specific occupations. One can turn to DEED's Job Vacancy Survey (JVS) for hiring demand by occupation, and the characteristics of that hiring demand. DEED's Employment Outlook tool shows how quickly an occupation is anticipated to grow through the next decade, and how many net new and replacement openings that equals. The tools are in place to provide for greater understanding of occupations throughout Minnesota, answering questions such as: How prevalent is this occupation in Minnesota? How much does the typical worker earn? What are the educational requirements for current openings? Will this occupation be in demand in the future?
Yet, there's much more to an occupation than simply estimated employment, wages, and demand, for example the nature of work for specific occupations. While one can certainly look up occupational definitions and the main tasks for an occupation with DEED labor market information, these sources do not answer the question: what are specific occupations like on the day-to-day? What are the physical demands? What kind of environment can workers expect? What are the cognitive and mental requirements?
When it comes to a specific job, there is a lot to consider beyond the title, the quick definition, the wage, the demand, the expected growth, and even the specific tasks and responsibilities. There is the day-in and day-out work that takes place, that makes up the nature of the job. Work that may be outside or inside. Work that may require more standing or more sitting. Work that may require constant interaction with people or may be entirely independent. Work that may be fast-paced and physically demanding, or work that may require more analysis, monitoring, or leadership.
To help complete the picture of what a job is like day to day, beyond the data typically found in labor market information, the U.S. Bureau of Labor Statistics (BLS) created the Occupational Requirements Survey, or ORS. This article will provide an introduction to the ORS, the data that it provides, and how it can be used together with typical labor market information to provide a more complete understanding of specific occupations.
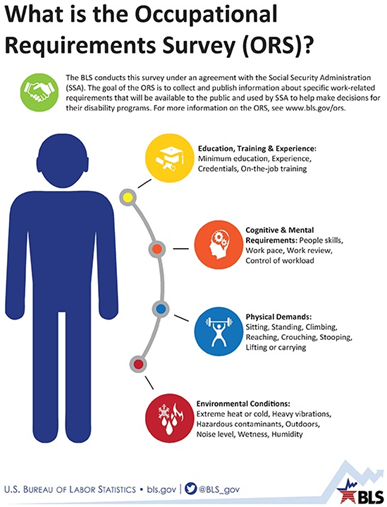
According to the BLS, the Occupational Requirements Survey (ORS) provides job-related information regarding physical demands; environmental conditions; education, training, and experience; as well as cognitive and mental requirements for jobs in the U.S. economy. The survey itself is conducted by the BLS under an interagency agreement with the Social Security Administration (SSA). In its second wave, there were approximately 60,000 establishments sampled across the U.S. over a 5-year period, between 2018 and 2023. These establishments include both private sector and state and local government. Major exclusions from the survey include federal government establishments, establishments in Agriculture, Forestry, Fishing, and Hunting, workers employed by private households, contractors, the self-employed, volunteers, unpaid workers, individuals receiving long-term disability compensation, and those working overseas.
 The ORS, according to the BLS, is designed to explain what is required to perform critical job functions of selected jobs. Put another way, the BLS notes that the objective of the survey is to measure job requirements, not the characteristics of the workers. Again, these job requirements come in four main areas:
The job requirements above are available for nearly 400 detailed occupations (6-digit SOC codes), the 22 major occupational groups (2-digit SOC codes), as well as for the total of all occupations.
The ORS data can be accessed online. There are several ways of analyzing the data, including:
The BLS also has a Handbook of Methods covering all aspects of the ORS, from concepts and data sources to design and history.
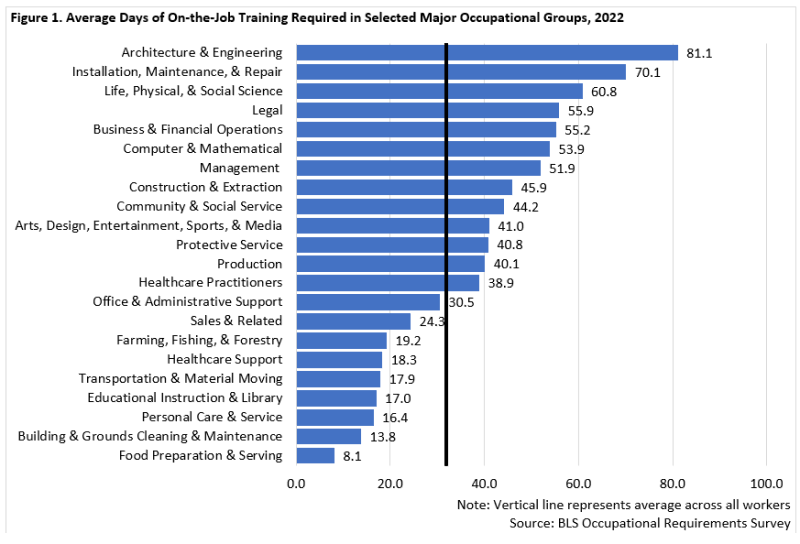
Using data from the ORS, one can compare major occupational groups and specific occupations. This can be done for specific variables within the four major areas of job requirements. Turning first to Education, Training, and Experience, one example is on-the-job training. Measured in days, the ORS survey shows the national average across all establishments to be just over six full work weeks, or 31.8 days of on-the-job training. Thirteen major occupational groups require more than six weeks of on-the-job training, while the remaining nine require less. At the top, Architecture & Engineering occupations require an average of 81.1 days of on-the-job training, or about four months of full-time training. Other major occupational groups requiring more than ten full-time weeks of on-the-job training include Installation, Maintenance, and Repair; Life, Physical, & Social Science; Legal; Business & Financial Operations; Computer & Mathematical; and Management (Figure 1).
Those specific 6-digit SOC occupations requiring the most on-the-job training include Heating, Air Conditioning, & Refrigeration Mechanics & Installers (206.0 days of on-the-job training); Locksmiths & Safe Repairers (179.8 days); Architectural & Civil Drafters (127.1 days); Firefighters (125.4 days); Civil Engineering Technologists & Technicians (125.3 days); Chief Executives (110.7 days); Police & Sheriff's Patrol Officers (106.2 days); Bus & Truck Mechanics & Diesel Engine Specialists (103.8 days); Project Management Specialists (102.8 days); and Industrial Machinery Mechanics (98.3 days). Each of these occupations required, on average, five months or more of full-time on-the-job training.
Just this one estimate, average on-the-job training required, can reveal more about specific occupations or occupational groups to those who may be interested in learning more about them. Combined with other labor market information, such as educational requirements, starting or median wages, and projected growth can provide for a more complete understanding of possible entry points and career pathways. For Education, Training, and Experience within the ORS, select categories include Specific Vocational Preparation, Credentials, Prior Work Experience, On-the-Job Training, and Minimum Education Level.

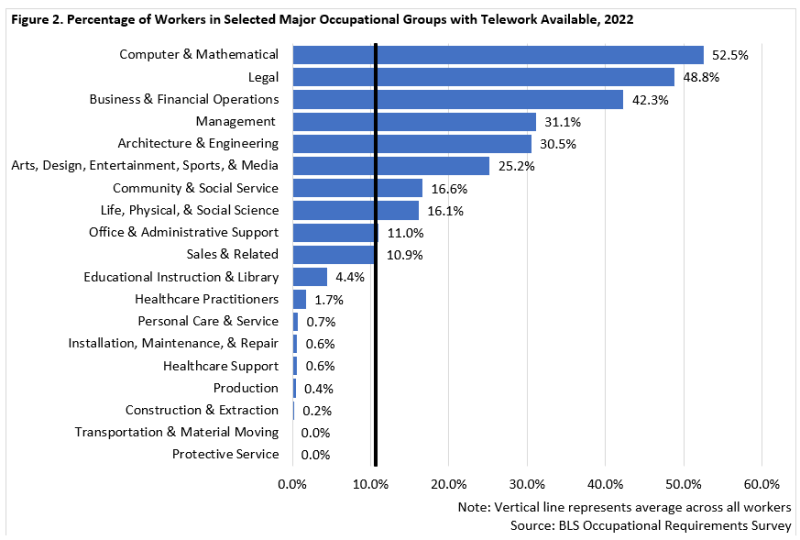
Within Cognitive and Mental Requirements, specific categories range from the ability for workers to control their workload and work pace, to various levels of work review and supervision, to personal contact and interaction with the general public, to problem solving and telework. Using telework as an example, the ORS reveals those major occupational groups with the most telework available include Computer & Mathematical; Legal; Business & Financial Operations; Management; Architecture & Engineering; and Arts, Design, Entertainment, Sports, & Media. Each of these occupational groups has well more than double the availability for telework across all occupations, which was at 10.6% in 2022 (Figure 2).
Telework, in this case, captures information about "work location and arrangements, work flexibility, supervision and work review, and interaction with others…the element intends to identify jobs in which workers have the flexibility to regularly perform their critical job functions off premises of the employer, in the privacy of the workers' homes for an agreed-upon portion of their work schedule."1 The ORS shows that telework was not prevalent for most workers, with 84.4% of all workers not having telework available in 2022. Those occupational groups with the largest shares of no telework available include Protective Service; Transportation & Material Moving; Construction & Extraction; Production; Healthcare Support; Installation, Maintenance, & Repair; Personal Care & Service; and Healthcare Practitioners.
This type of information on teleworking can provide more insights into this aspect of work, and recent trends in teleworking, that can also be revealed through resources like the Current Population Survey (CPS) or American Community Survey (ACS).

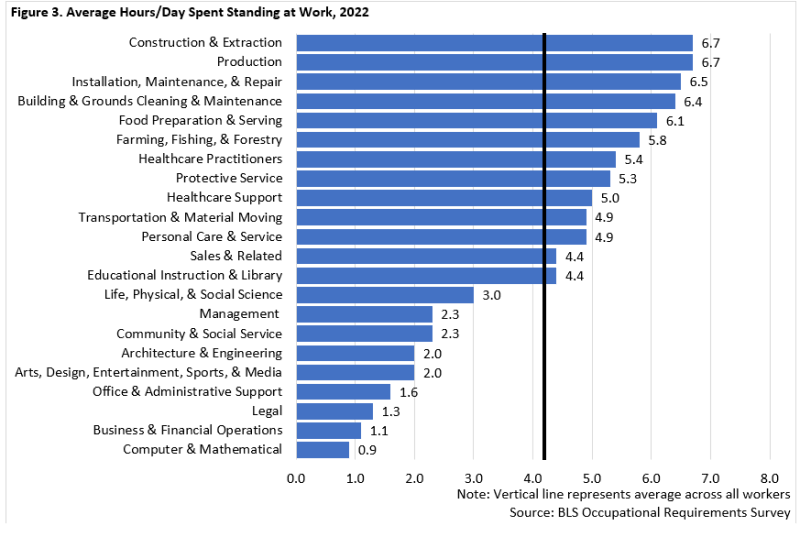
The Physical Demands requirement in the ORS includes 22 select categories, ranging from low postures and choice of sitting or standing to lifting and carrying and vision. Within the category of standing, several different estimates look at how prevalent this is within specific jobs. One of these estimates is the average number of hours spent standing. For all workers, the average was 4.2 hours spent standing at work. This ranged from an average of 0.9 hours spent standing for Computer & Mathematical Occupations to 6.7 hours spent standing for both Production Occupations and Construction & Extraction Occupations (Figure 3).
In a similar estimate, the ORS reveals the average percent of the workday where standing is required. This is highest for workers in Food Preparation & Serving, where an average of 97.2% of the workday has required standing. This average is also high for workers in Building & Grounds Cleaning & Maintenance (87.8%); Production (81.4%); Construction & Extraction (80.9%); Installation, Maintenance, & Repair (79.5%); Personal Care & Service (77.1%); and Farming, Fishing, & Forestry (77.1%). This is lowest for workers in Computer & Mathematical, where an average of 11.4% of the workday has required standing. This average is also low for workers in Business & Financial Operations (13.2%); Legal (16.3%); and Office & Administrative Support (21.0%).
Becoming more familiar with the physical characteristics of jobs can provide for another level of occupational understanding. This type of information can also assist employers, workers, and job seekers with understanding possible accommodations that would enable persons with disabilities to perform critical occupational tasks. In the case of standing or sitting at work, such accommodations may be allowing a worker to stand for a job normally performed sitting or sit for a job normally performed standing. The data can provide a more complete understanding of accommodations for a person with a disability that are likely available in an occupation. This is important because workers with disabilities in Minnesota continue to experience higher unemployment rates than the general population.

When analyzing requirements for Environmental Conditions, one specific variable is the percent of workers exposed to the outdoors. Analyzing 6-digit SOC codes, those occupations where 100% of workers are exposed to the outdoors include Packaging & Filling Machine Operators & Tenders, Firefighters, Landscaping & Groundskeeping Workers, Cement Masons & Concrete Finishers, Construction Laborers, Roofers, Highway Maintenance Workers, and Rail-Track Laying Maintenance Equipment Operators. Zooming out to 2-digit SOC codes, those occupational groups with more than half of their respective workers exposed to the outdoors include:
At the other end of the spectrum, those occupational groups with less than one-quarter of their respective workers exposed to the outdoors include:
Those 6-digit occupations with the least exposure to the outdoors include Financial Managers; Computer Systems Administrators; Bookkeeping, Accounting, & Auditing Clerks; Human Resource Specialists; Executive Secretaries & Executive Administrative Assistants; Marketing Managers; Purchasing Managers; Computer Network Support Specialists; Management Analysts; and Customer Service Representatives.
Beyond the outdoors, other select categories in the Environmental Conditions requirement include Extreme Cold, Extreme Heat, Wetness, Humidity, Heavy Vibrations, Heights, Proximity to Moving Mechanical Parts, Noise Intensity Level, and Hazardous Contaminants.
Throughout this introduction to the ORS and its four main requirements - Education, Training, and Experience; Cognitive and Mental Requirements; Physical Demands; and Environmental Conditions - this article has selected specific categories and estimates to compare among the major occupational groups. This type of analysis provides a broad understanding of the labor market and what different jobs will be like on the day-to-day. The ORS also allows users to focus on one specific occupation, with all requirements, categories, and estimates providing an in-depth look at what that job will entail.
In this next section, a case study of Registered Nurses provides an example of how the ORS can be used to analyze and more completely understand an occupation beyond standard labor market information.
According to its Standard Occupational Classification (SOC) definition, Registered Nurses (RNs) "assess patient health problems and needs, develop and implement nursing care plans, and maintain medical records…administer nursing care to ill, injured, convalescent, or disabled patients…may advise patients on health maintenance and disease prevention or provide case management…licensing or registration required." The Department of Employment and Economic Development's (DEED) Occupational Employment and Wage Statistics (OEWS) tool highlights this occupational definition, while also listing common tasks for RNs. DEED's OEWS tool also shows that there are an estimated 63,800 RNs in Minnesota, with a median hourly wage of $41.96 in 2023. This made RNs Minnesota's third largest-employing occupation, with the typical RN making $36,800 more per year than the typical worker overall (Table 1).
Additional labor market information from DEED provides information on employment projections, hiring demand, and educational attainment requirements. For example, employment for RNs is anticipated to grow by 6.6% in Minnesota between 2020 and 2030. Comparatively, employment for the total of all occupations is anticipated to grow by 5.7%. In 2022, employers across the state reported over 5,600 job vacancies for RNs, with virtually all openings requiring postsecondary education.
| Table 1. Registered Nurses Select Occupational Statistics, Minnesota | ||||||
|---|---|---|---|---|---|---|
| SOC Code | Occupational Title | Estimated Employment | Median Hourly Wage | 2020-2030 Projected Growth Rate | 2022 Job Vacancies | Typical Education Required for Entry |
| 291141 | Registered Nurses | 63,800 | $41.96 | 6.6% | 5,625 | Associate degree |
| 000000 | Total, All Occupations | 2,827,310 | $24.25 | 5.7% | 184,588 | - |
| Source: DEED Occupational Employment and Wages Statistics, DEED Employment Outlook, DEED Job Vacancy Survey | ||||||
In the case of RNs, one can use standard labor market information to discover that they're a large-employing and high-paying occupation in Minnesota, with a high number of current job vacancies, and rapid projected employment growth through the next decade. One can determine that an associate degree is typically required for entry into the occupation.
Beyond these data, however, users of the ORS can get a better idea of what it's like to be an RN. For example, with Education, Training, and Experience, one can see that a higher share (49.1%) of RN positions require a bachelor's degree at minimum, when compared to the total of all workers (19.0%). With Cognitive and Mental Requirements, one can see that typical RN work is fast paced, without the ability to pause work. There's a greater interaction with the public for RNs than for most other workers, and there is a very small availability to telework (Table 2).
The ORS data also reveals that RN work can be physically demanding. For example, pushing or pulling with hands or arms is commonplace each day and foot or leg controls are often required. RNs stand for an average of over six hours per day, compared to just over four hours per day for the total of all workers. Stooping is often required, reaching overhead with both hands is common each day, fine manipulation with both hands is nearly always required each day, and RNs are often called to lift a heavy amount of weight. The ORS can also show what kind of environment can be expected for this work. For example, while RNs are almost never exposed to outdoor work, and are in temperature-controlled areas, they are exposed to moderate levels of noise as well as wetness when compared to the total of all workers. A fair share may also be required to utilize personal protective equipment (PPE) for hazardous contaminants.
| Table 2. Select Occupational Requirements Survey Estimates for Registered Nurses, 2022 | |||
|---|---|---|---|
| Requirement and Estimate | Estimate Value | Standard Error | Total, All Workers Estimate |
| Education, Training, and Experience | |||
| Percent of workers, specific vocational preparation is over 2 years through 4 years | 61.9% | 2.5 | 20.1% |
| Percent of workers, specific vocational preparation is over 4 years through 10 years | 16.3% | 2.4 | 17.7% |
| Percent of workers, prior work experience is required | 49.2% | 4.1 | 47.5% |
| Percent of workers, on-the-job training is required | 72.9% | 2.9 | 79.0% |
| Days of on-the-job training, mean | 35.30 | 3.22 | 31.75 |
| Percent of workers, minimum education level is an associate degree | 25.3% | 2.1 | 4.3% |
| Percent of workers, minimum education level is an associate's vocational degree | 25.0% | 2.6 | 1.9% |
| Percent of workers, minimum education level is a bachelor's degree | 49.1% | 2.8 | 19.0% |
| Cognitive and Mental Requirements | |||
| Percent of workers, with consistent, generally fast work pace | 52.7% | 3.5 | 37.0% |
| Percent of workers, without the ability to pause work | 70.8% | 1.8 | 43.8% |
| Percent of workers, interaction with the general public is required | 99.7% | <0.5 | 78.7% |
| Percent of workers, with telework not available | 97.3% | 1.4 | 89.4% |
| Percent of workers, supervisory duties are required | 31.9% | 1.9 | 16.2% |
| Physical Demands | |||
| Percent of workers, keyboarding is required | 98.1% | 0.7 | 66.1% |
| Percent of workers, pushing or pulling with hands or arms is required | 62.5% | 2.4 | 21.2% |
| Percent of workers, foot or leg controls is required | 37.8% | 3.6 | 29.5% |
| Percent of workers, hearing over the telephone is required | 98.9% | 0.6 | 77.8% |
| Percent of the day where standing is required, mean | 68.5% | 1.2 | 56.4% |
| Hours of standing, mean | 6.22 | 0.11 | 4.17 |
| Pounds maximum weight lifted or carried, mean | 40.43 | 1.37 | 25.98 |
| Percent of workers, stooping is required | 29.7% | 2.7 | 17.6% |
| Percent of workers, reaching overhead is required | 69.4% | 2.9 | 38.6% |
| Percent of workers, fine manipulation is required, both hands | 84.6% | 1.8 | 62.2% |
| Environmental Conditions | |||
| Percent of workers, exposed to wetness | 88.0% | 1.5 | 33.5% |
| Percent or workers, exposed to moderate noise | 84.4% | 2.0 | 79.7% |
| Percent of workers, not exposed to outdoors | 95.7% | 1.4 | 67.1% |
| Percent of workers, utilizing personal protective equipment for hazardous contaminants | 5.6% | 1.1 | 6.2% |
| Percent of workers, not exposed to extreme heat or cold | 99.6% | <0.5 | 95.5% |
| Source: BLS Occupational Requirements Survey | |||
There are a host of data tools and resources available for career seekers, employment counselors, educators, students, and others through DEED's Labor Market Information (LMI) Office. Many of these tools highlight recent trends and conditions for occupational groups and specific occupations. DEED LMI data can be easily accessed through the Explore Occupations tool on CareerForceMN. Users can add in recent survey data from the Bureau of Labor Statistics' Occupational Requirements Survey to learn even more about these occupational groups and specific occupations in their career exploration.
1Cluskey, Kenneth, and Kristen Monaco. "Minds at Work: What's Required According to the Occupational Requirements SurveyM/a>." Beyond the Numbers, vol. 10, no. 5, Mar. 2021.