by Mohamed Mourssi-Alfash
December 2016
People with disabilities face challenges in the labor market, both in Minnesota and nationally.
There is a substantial gap between the goal of integrating people with disabilities into the labor force and their actual levels of participation. Labor force disparities for people with disabilities also vary from one type of disability to another, resulting in some groups showing higher or lower rates of participation than others.
This article explores disability definitions, prevalence of disabilities and labor force disparities that are often associated with disability. Labor force metrics for Minnesotans with disabilities are compared with national metrics. The article focuses on the non-institutional working-age population between the ages of 21 and 64. Data and analyses in this article are based on one-year estimates from the 2014 American Community Survey.
Though there is not one standard definition of disability, this article considers the definition adopted by the U.S. Census Bureau. The Census Bureau uses the definition found in the Americans with Disabilities Act (ADA), which defines disability as an individual's physical or mental impairment that substantially limits one or more major life activities. The Census Bureau collects data on disability in six categories:
The 2014 American Community Survey (ACS) one-year estimates show that the six categories of disability were prevalent in the population at varying levels. Chart 1 indicates that general disability prevalence in Minnesota is lower than the national level, as well as in all categories of disability. The general disability prevalence rate in the working-age population in Minnesota was 8.8 percent compared with 10.8 percent nationally.
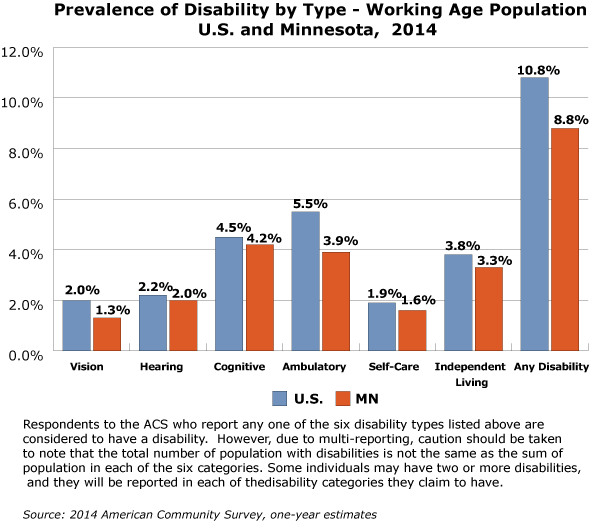
Out of the six disability types reported in the ACS, cognitive difficulty was the most frequently reported disability type in Minnesota, at 4.2 percent, while ambulatory difficulty was the most frequently reported nationally, at 5.5 percent. The lowest prevalence rate in Minnesota was vision difficulty, at 1.3 percent, while nationally it was self-care difficulty, at 1.9 percent.
In general, Minnesota ranks among the highest in labor force participation in the overall population and in the groups covered in this article. ACS data indicate that people with disabilities are less likely to participate in the labor force than people with no disabilities.
Chart 2 shows that in 2014 the rate of labor force participation in the working age population with any disability was 48.7 percent in Minnesota and 8.1 percentage points lower nationwide. In the same age group with no disability, the rate was 82.6 in the U.S. and 87.6 in Minnesota. The gap between participation in the working-age labor force with and without disabilities was 38.9 points in Minnesota and 42 points nationwide.
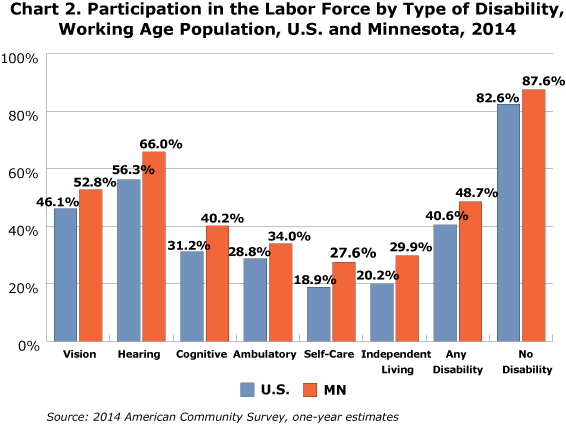
Among the six types of disabilities identified in the ACS, the highest rate of participation in the labor force was for people with hearing disability, at 66 percent in Minnesota and 56.3 percent nationally. The lowest participation rate was for people with self-care disability, at 27.6 percent in Minnesota and 18.9 percent nationally.
Employment ratio is another important labor market benchmark that measures the proportion of the working-age population that is employed. Similar patterns of disparity between people with and without disabilities are evident in this measure.
In 2014, the employment ratio of working-age people with disabilities in Minnesota was 44 percent compared with 34.6 percent in the U.S. The employment ratio of working-age people without disabilities in Minnesota was 84.3 percent compared with 77.6 percent nationally. The gap between employment ratios of working-age people with and without disabilities was 40.3 percentage points in Minnesota, compared with 43.0 percentage points in the U.S.
Among the six types of disabilities reported in the ACS, Table 1 shows that the hearing disability group had the highest employment ratio, at 62.5 percent in Minnesota and 51.2 percent nationwide. The lowest employment ratio at both the state and national level was for people with a self-care disability, at 25.7 percent in Minnesota and 15.5 percent nationally.
| Working Age Population with Disability, U.S. and Minnesota, 2014 | ||||||||
|---|---|---|---|---|---|---|---|---|
| Working-Age Population with Disability | ||||||||
| Vision | Hearing | Cognitive | Ambulatory | Self-Care | Independent Living | Any Disability | No Disability | |
| U.S. | 3,692,900 | 3,980,800 | 8,179,900 | 10,116,500 | 3,545,000 | 6,977,300 | 19,754,700 | 163,511,000 |
| MN | 42,400 | 63,800 | 133,000 | 125,200 | 51,400 | 105,400 | 280,000 | 2,894,100 |
| Employed Working-Age Population with Disability | ||||||||
| - | Vision | Hearing | Cognitive | Ambulatory | Self-Care | Independent Living | Any Disability | No Disability |
| U.S. | 1,492,700 | 2,037,700 | 1,979,700 | 2,449,500 | 548,700 | 1,113,800 | 6,840,200 | 126,901,900 |
| MN | 21,600 | 39,900 | 45,900 | 37,600 | 13,200 | 27,300 | 123,200 | 2,439,200 |
| Employment to Population Ratio of those with Disability | ||||||||
| - | Vision | Hearing | Cognitive | Ambulatory | Self-Care | Independent Living | Any Disability | No Disability |
| U.S. | 40.4% | 51.2% | 24.2% | 24.2% | 15.5% | 16.0% | 34.6% | 77.6% |
| MN | 50.90% | 62.5% | 34.5% | 30.0% | 25.7% | 25.9% | 44.0% | 84.3% |
| Source: 2014 American Community Survey, one-year estimates | ||||||||
The gap between the unemployment rate of those with and without disabilities in Minnesota and the U.S. is substantial. In 2014, the unemployment rate for working-age people with any type of disability was 9.6 percent in Minnesota and 14.8 percent nationally. This compares with 3.8 percent in Minnesota and 6 percent nationally for those with no disability.
As shown in Chart 3, unemployment rates vary across types of disability. Of the disability types, those with hearing difficulty reported the lowest unemployment rate in the U.S. at 9.1 percent, while in Minnesota this group had the second-lowest unemployment rate at 5.2 percent.
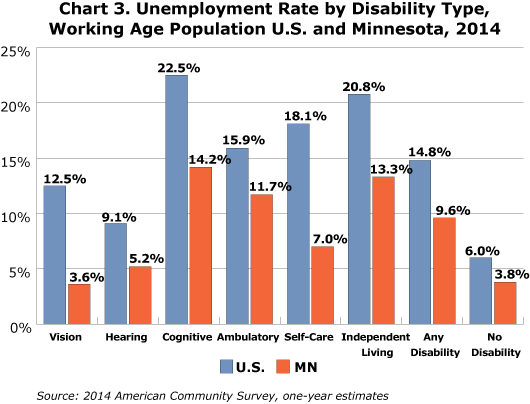
The second-lowest unemployment rate nationally was among those with vision difficulty, at 12.5 percent. In Minnesota the unemployment rate for this group was 3.6 percent, ranking it the lowest among the six types of disability. The highest unemployment rate was observed among those with a cognitive disability, at 14.2 percent in Minnesota and 22.5 percent nationally. This indicates that people with cognitive disability struggle to find or maintain employment more than those with other types of disability.
This section provides a measure of job quality of working-age people with disabilities. Although part-time or intermittent/seasonal work is sometimes a voluntary choice, full-time, year-round employment tends to be of higher quality for two reasons: It more often comes with health insurance and retirement benefits and it tends to offer more opportunities for career advancement. Employees are considered full-time if they work 35 or more hours a week and full year if they work at least 50 weeks per year. In the context of this article the rate of full-time/full-year is calculated as a percentage of the employed population with disabilities aged 21-64 in each category.
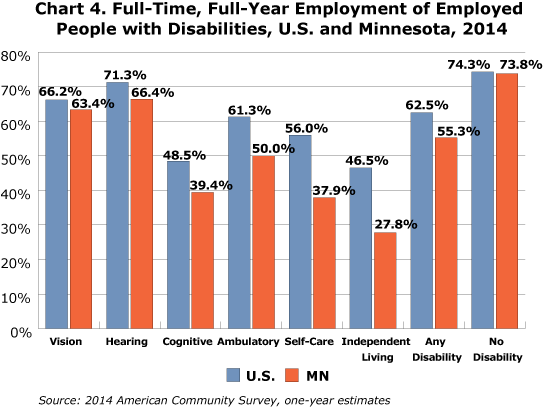
The data in Chart 4 indicate that the full-time, full-year employment rate in the employed working-age population with a disability was lower in Minnesota, at 55.3 percent, than nationally, at 62.5 percent. Similarly, in the employed working-age population with no disabilities, Minnesota's rate of 73.8 percent was slightly lower than the national rate of 74.3 percent.
The most likely explanation for why the state-national gap is so much bigger for people with disabilities than those without disabilities is because of Minnesota's policy of segregated employment for people with disabilities. This policy allows employers to hire people with disabilities to do parts of a job and get paid less than the minimum wage, based on the extent to which a worker's performance is limited. In no case, however, may pay fall below 50 percent of the minimum wage. While this may increase overall employment, it has the tendency to lower average job quality for people with disabilities by allowing for lower wages and more part-time hours.
As was the case with other labor force characteristics, the full-time, full-year employment rate varies across types of disability, with hearing difficulty showing the highest rate, at 66.4 percent in Minnesota and 71.3 percent nationally for full-time, full-year employment status. The vision difficulty group ranked second at 63.4 percent in Minnesota and 66.2 percent nationally.
The most disadvantaged group in the share of full-time, full-year employed was the group with an independent living disability, which reported 27.8 percent in Minnesota and 46.5 percent nationally, followed by the cognitive disability group with 39.4 percent in Minnesota and 48.5 percent nationally.
In both Minnesota and the U.S., people with disabilities are much more likely to have incomes below the poverty level than are people of the same age group who do not have disabilities. This can be largely explained by lower rates of labor force participation, lower employment-to- population ratios, higher rates of unemployment and lower rates of full-time, full-year job holding.
The Federal Poverty Level, a measure of income, is set at three times the cost of a minimum food diet in 1963, updated annually for inflation and calculated for individuals and families of different sizes. Individuals and families with pre-tax cash income at or below these thresholds are considered to be in poverty. The poverty threshold for a family of four in 2014 was $24,036.
Chart 5 shows that 26.9 percent of the working-age population with disabilities in Minnesota was living below the poverty threshold in 2014, compared with 28.1 percent nationwide. These rates are more than double those for the working-age population without disabilities, which was 8.8 percent in Minnesota and 12.2 percent nationally in 2014.
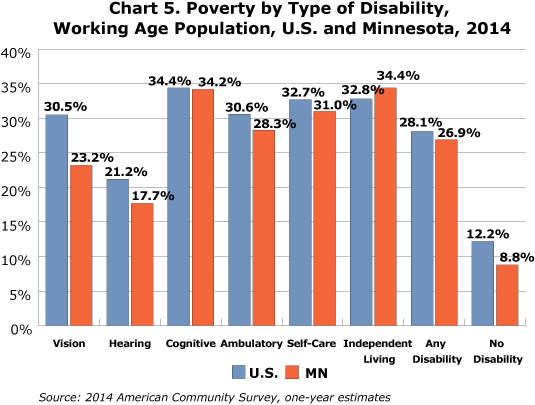
Poverty rates vary by disability type. Hearing difficulty showed the lowest poverty rate at 17.7 percent in Minnesota and 21.2 percent nationally. Poverty among people with vision difficulty was 23.2 percent in Minnesota compared with 30.5 percent nationally. Among those with cogitative, ambulatory or self-care disabilities, Minnesota had a slightly lower poverty rate than the nation. Minnesota had a higher rate of poverty, however, for those with independent-living difficulty, at 34.4 percent compared with 32.8 percent nationally.
This article has reviewed major labor force indicators for people with disabilities broken down by disability type and includes comparisons between Minnesota and the nation as of 2014.
Obviously, people with disabilities continue to face challenges in the labor market in both Minnesota and nationwide, and there are still substantial gaps between the labor force characteristics among populations with and without disabilities in the nation and the state.
In addition, data confirm that disparities exist among the six types of disabilities identified in the ACS, with some groups of disabilities showing better or worse labor force metrics than others. The ACS data also indicate that cognitive disability, self-care disability and independent-living disability are the most disadvantaged groups among the six types of disabilities in the labor force metrics covered in this article.
In contrast, people with hearing, vision or ambulatory disability tend to experience better labor force outcomes. That may be due to a range of factors, including the relative affordability of accommodations needed for hearing, vision and ambulatory disabilities, lack of readiness or ability to participate in the labor force among the cognitive, self-care independent-living disabled groups, and/or the lack of awareness of employers about effective strategies to engage people with these disabilities within the workforce.