by Alessia Leibert
March 2016
DEED’s Graduate Employment Outcomes (GEO) tool provides data on jobs and earnings outcomes for students who attended post-secondary schools in Minnesota.
Going to college represents a major financial and time investment, whether students go straight out of high school, as working adults with families, or in any other life circumstance. Prospective college students wrestle with questions like: Which schools have the most appealing programs? Does it make sense to relocate for college or choose a school close to home? Will I be able to find a job after college that allows me to pay back my student loans and support myself and my family?
The Minnesota Department of Employment and Economic Development (DEED) has just released data on job and earnings outcomes for students who attended 128 post-secondary schools in Minnesota.1 The information, which can be accessed through the GEO tool, is being made public for the first time thanks to a new law calling for the public disclosure of the employment outcomes of graduates for each institution of higher education in Minnesota.
Thanks to the new information, students can:
Although this tool does not cover all information needs, it reduces the risks and uncertainties involved in the decision to go to college, and it narrows the list of questions to ask on a college visit. If there are strong differences in what students have been able to do with the same degree attained at different schools, perhaps the difference is tied to tuition prices, selectivity in admissions, difficulty of the course work or characteristics of the student body at each school. These are good questions to ask college representatives to help decide what programs at what schools provide the best fit.
College rankings websites have proliferated in the last few years, rating schools on all sorts of things. For example, College Scorecard of the U.S. Department of Labor discloses important information on tuition costs, graduation rates and post-graduation earnings of recent graduates.
College Scorecard has two important limitations, however. First, the information is based on data from a limited subset of students. Second, it presents a single number for an entire school without providing a detailed breakdown by field of study and degree. Straight comparisons can be misleading because they do not take into account what students study in each school. For example, vocational schools that put a student on track for a specific job and two-year liberal arts schools that prepare for transferring to four-year programs will obviously have lower earnings outcomes compared with large public universities offering bachelor’s, master’s and Ph.D. degrees.
The Graduate Employment Outcomes tool offers a more complete picture of the returns to education, including:
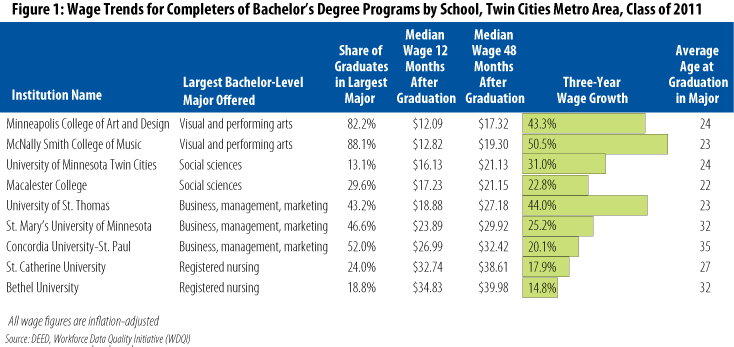
People who complete degrees at certain colleges tend to have higher earnings than others, not necessarily because of differences in the quality of instruction. Differences in student demographics and in the mix of academic programs offered also affect earnings, as illustrated in Figure 1 for bachelor’s degree majors in selected schools located in the Twin Cities area.

In this table we observe that:
These examples demonstrate how comparisons of outcomes at the detailed degree and major level are more meaningful than school rankings. Families often focus too much on pursuing the best college and not enough on choosing fields of study that fit best with a student’s career goals and academic strengths, as well as the market demand for the skills acquired at school.
To keep talented workers in Minnesota, businesses must provide jobs that offer living wages and schools must align program offerings and curricula with business needs. Market alignment can be measured in two main ways:
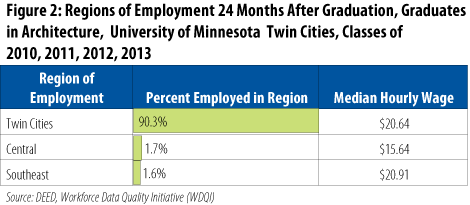
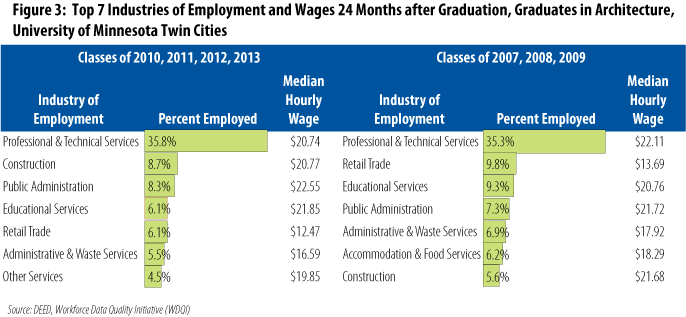
Both of these measures are accessible through the Graduate Employment Outcomes tool. Figures 2 and 3 offer an example for bachelor’s and above programs in architecture at the University of Minnesota (UMN) Twin Cities campus. As shown in Figure 2, the overwhelming majority of graduates (90.3 percent) were employed in the Twin Cities 24 months after graduation and earned a median wage of $20.64. By and large, the program met the recruitment needs of local employers. This does not tell us, however, if graduates were in architecture-related jobs. Figure 3 answers that question.


Among 2010-2013 completers, 35.8 percent of employed graduates held jobs in professional and technical services, an industry that includes architectural, landscape architectural and building inspection services. Median wages of $20.74 in this industry suggest that graduates, for the most part, were working in jobs related to their educational program.
The second and third industries of employment, construction and public administration, are also an excellent fit with an educational background in architecture. Median wages of $20.77 and $22.55 further confirm that jobs held in these industries were aligned with the field of study. This stands in stark contrast with a median wage of $12.47 earned by graduates employed in retail trade. Wages this low indicate employment in jobs that did not require a bachelor’s degree. We can conclude that at least 60 percent of employed UMN architecture graduates in school years 2010-2013 succeeded in finding jobs that reward their academic credentials, while 6.1 percent were employed in jobs for which they are over-qualified.
Interestingly, when we go back in time to school years 2007-2009, we find only 5.6 percent of UMN architecture graduates employed in the construction industry. More graduates were employed in unrelated, lower-wage industries such as retail and accommodation and food services (see Figure 3). Programs in architecture were impacted by the housing market collapse that caused huge job losses in the construction industry during the Great Recession. Thanks to the recovery of the housing market in 2012, architecture-related skills became more marketable and more graduates were able to find employment in industries well aligned with their field of study.
Clearly these data reveal as much about Minnesota’s economic opportunities for college graduates as they do about the schools themselves. Schools offering programs that feed into highly cyclical industries such as construction are well advised to engage in rigorous review processes that help them respond quickly to changing labor market conditions either by appropriately scaling the size of the program or modifying program curriculum.
Post-secondary educational institutions are being held accountable not only for how many students go through their programs and obtain a credential, but also for how graduates fare in the labor market post-graduation. Students and families need this transparency because it provides necessary information to research higher education options. It is critical for students to focus not only on where to study but even more importantly on what to study to ensure that their educational investments equip them with skills in demand by employers.
The GEO tool is also an essential source of intelligence for schools to identify which programs and academic specialties are in highest demand locally and decide how program offerings can be improved. Schools can and should learn from the experience of their graduates. They can also use this evidence to demonstrate their contribution to the local economy and to build connections with regional partners, including employers, workforce investment boards, workforce program administrators and policymakers who share the common goal of building the workforce skills of the future.
1Outcomes by individual school are only available for the 128 institutions that are still active in Minnesota. However, aggregate results displayed in the tool represent data from all 160 post-secondary institutions in Minnesota including those that have closed or are closing in 2016.
2The UI data cover 97 percent of non-agricultural wage and salary employment in Minnesota. The data exclude small agricultural businesses that employ fewer than four people, military employment, and some categories of self-employment and federal civilian employment.