by Tim O'Neill
September 2016
If you are reading this issue of Employment Review, you are probably well-versed in the number and variety of labor market resources available through the Department of Employment and Economic Development (DEED). If you happened to grab this publication out of the blue, however, you should know that there are over 20 labor market information tools readily available online just waiting to be discovered. These tools vary widely, and cover everything from occupational wages to industry projections to unemployment statistics. One of these tools, the Job Vacancy Survey, will be the main focus of this feature article.
Data from DEED’s Job Vacancy Survey (JVS) are frequently used to highlight hiring demand across the state of Minnesota. The previous issue of Employment Review pulled fourth quarter 2015 JVS data to analyze the job market in Southeast Minnesota. Since the release of that issue, new second quarter 2016 JVS data have been released. So what do these data consist of, and what can they be used for?
Data within DEED’s JVS come from a stratified sample of approximately 10,000 business establishments in 13 different regions of Minnesota. Knowing this, individuals using these data can analyze job vacancies in their area by industry and occupation. Beyond the simple number of vacancies, the data can also be broken down by a number of characteristics, including wages and benefits, education and experience requirements, firm size, and full-time versus part-time status. Additionally, users of the data can look at vacancy trends going back to 2001. With the most recent release of data, everyone from job-seekers and employment counselors to educational program planners and employers can see where current hiring demand is and how it has changed over time.
More than seven years after the height of the Great Recession, the labor market in Minnesota has changed drastically. On one hand, job growth has come roaring back, with the economy adding more than 280,000 jobs since the depths of the recession in 2009. In line with job expansion, the state’s unemployment rate has shrunk from a high of 7.8 percent in 2009 to 3.6 percent in 2015. On the other hand, however, the state’s population has been steadily aging with the number of Minnesotans turning 65 in this decade (about 285,000) greater than the past four decades combined.1 One result is that baby-boomers will be retiring at accelerated rates. So what does this all mean for hiring in Minnesota? To put it bluntly, employers are becoming desperate for workers.
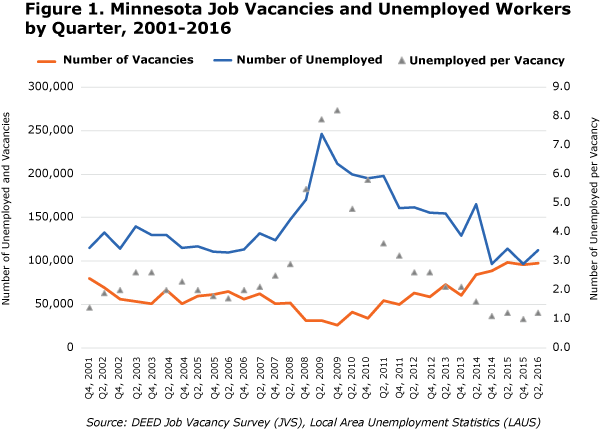
As of the second quarter 2016 the JVS recorded 97,580 job vacancies. While essentially the same as the previous year, job vacancies have risen consistently each year since 2009. When you compare job vacancies with declining unemployment, you can see just how tight Minnesota’s labor market has become. For example, at the height of the Great Recession in 2009, there were more than eight unemployed people for every job vacancy. Buffeted with high competition for available jobs, those seeking employment during this period knew the “creative job search” phrase all too well. As of 2016, the number of unemployed people per job vacancy has plummeted to about one. In this current market it is now employers who find themselves having to be creative to find and retain workers (see Figure 1).2

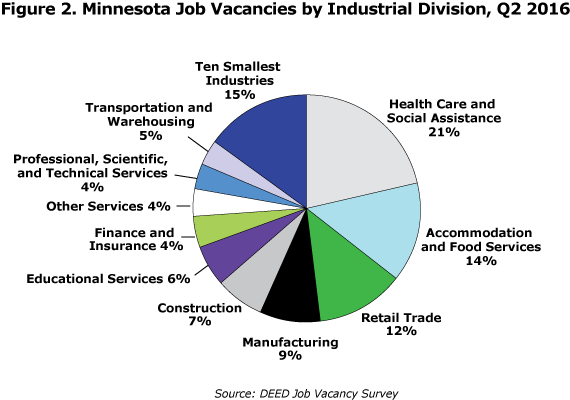
Beyond the total number of vacancies reported, DEED’s JVS tool reports on the distribution of such vacancies by industry sector. For example, over one in five reported vacancies were in Health Care and Social Assistance, making it the number one in-demand industry in the second quarter of 2016 (see Figure 2). Additionally, vacancies within Health Care and Social Assistance increased by 15.2 percent over the year, highlighting the need for workers in Minnesota’s largest-employing industry sector.

Down the line, Construction accounted for 7 percent of current demand in the state with approximately 6,700 reported vacancies. During the height of the recent recession, construction employers reported less than 400 vacancies, but demand has increased dramatically since 2009. Within the past year alone, construction vacancies spiked by 74 percent, making it the fastest-growing industry for demand. Other sectors reporting significant over-the-year growth in demand include Finance and Insurance, Manufacturing, Other Services, and Administrative and Support Services.
According to employment data from the U.S. Census Bureau’s Quarterly Workforce Indicators (QWI) tool, the percentage of statewide jobs held by older workers has increased significantly. Between the second quarters of 2010 and 2015 the number of jobs held by those 55 and older expanded by 27.3 percent. This change was three times faster than total employment growth. So what does this have to do with current vacancies?
As previously stated, the shift towards an older workforce will inevitably lead to a rapid increase in retirements. Transportation and Warehousing provides a prime example of this reality. Between the second quarters of 2010 and 2015, Transportation and Warehousing employment grew by 16.1 percent. At the same time, however, Transportation and Warehousing jobs held by those 55 and older grew by 42.0 percent. Assuming these older workers are beginning to retire at accelerated rates, the number of vacancies reported in this industry would be expected to increase in recent years. And that is exactly what has happened. Between the second quarters of 2010 and 2015, Transportation and Warehousing vacancies have climbed by an annual average of 37.8 percent. These trends are found in almost every industry sector in Minnesota (see Table 1).
| Table 1: Job Vacancy Trends by Industry | ||||
|---|---|---|---|---|
| Industry | Q2 2016 Vacancies | Q2 2010 – Q2 2016 Avg. Annual Change in Vacancies | Q2 2010 – Q2 2015 Employment Change | |
| Total Change Percent | Percent Change in Jobs Held by Those 55 and Older | |||
| Total, All Industries | 97,580 | 22.6% | 9.1% | 27.3% |
| Health Care and Social Assistance | 20,875 | 24.7% | 12.2% | 27.6% |
| Accommodation and Food Services | 14,020 | 37.3% | 11.6% | 34.9% |
| Retail Trade | 11,987 | 25.5% | 0.5% | 18.0% |
| Manufacturing | 8,536 | 21.1% | 9.6% | 37.2% |
| Construction | 6,696 | 74.7% | 34.9% | 64.1% |
| Educational Services | 5,801 | 7.4% | 5.8% | 13.5% |
| Finance and Insurance | 4,233 | 11.5% | 1.3% | 24.9% |
| Other Services, Excluding Public Administration | 3,914 | 46.3% | 4.8% | 20.1% |
| Professional and Technical Services | 3,473 | 9.5% | 14.5% | 31.3% |
| Transportation and Warehousing | 3,404 | 37.8% | 16.1% | 42.0% |
| Wholesale Trade | 3,022 | 18.6% | 6.3% | 31.6% |
| Administrative and Waste Services | 2,899 | 22.0% | 11.0% | 38.4% |
| Arts, Entertainment, and Recreation | 2,286 | 11.6% | -1.7% | 13.9% |
| Management of Companies | 2,058 | 16.5% | 17.2% | 40.4% |
| Public Administration | 1,963 | 13.9% | 10.0% | 20.2% |
| Information | 1,428 | 5.0% | -2.5% | 16.1% |
| Agriculture | 418 | 22.3% | 21.4% | 50.2% |
| Real Estate and Rental and Leasing | 399 | -0.9% | 6.3% | 23.9% |
| Utilities | 137 | 11.5% | -26.0% | -13.5% |
| Source: DEED Job Vacancy Survey, U.S. Census Bureau Quarterly Workforce Indicators (QWI) | ||||
One of the strengths of DEED's JVS tool is that it can be utilized by job-seekers and students looking to discover which specific occupations are showing the most demand in Minnesota and its regions. This is especially useful considering the tightness of the current labor market.
Staying with Transportation, there were over 6,100 vacancies reported during the second quarter 2016 in Transportation and Material Moving Occupations. Filtering down to specific occupations, users of the JVS tool will discover employers reported more than 2,000 Heavy Tractor-Trailer Truck Driver vacancies or approximately one-third of total Transportation and Material Moving vacancies. With only seven occupations reporting more vacancies this is most certainly a high-demand occupation.
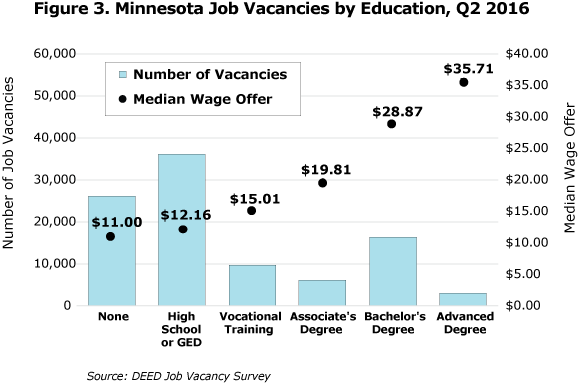
Once users discover where the hiring demand is, they can explore the data further to learn about vacancy characteristics. Of those more than 2,000 Heavy and Tractor-Trailer Truck Driving vacancies, for example, only 8 percent required post-secondary education. Zooming out, only 3 percent of Transportation and Material Moving vacancies required post-secondary education. Zooming out yet again, only 36 percent of those 97,580 vacancies reported for the second quarter 2016 required post-secondary education. In other words, the majority of vacancies in Minnesota's current job market do not require post-secondary education (see Figure 3).

In addition to educational requirements, the JVS reveals data on part-time work reported, temporary or seasonal work reported, the percentage of vacancies requiring related work experience, the percentage of vacancies requiring a certificate or license, median wage offers, and more.
With all of these data waiting to be discovered, job-seekers, students, and others have the opportunity to take advantage of current labor market conditions and find new or better employment successfully. Check out DEED's Job Vacancy Survey.
1Minnesota State Demographic Center/Aging.
2For employers having difficulties finding workers, visit DEED's website for helpful resources.