By Tim O'Neill
June 2015
The seven-county Twin Cities region has made a strong comeback since the recession.
 The Twin Cities Metro, the state planning region with the biggest economy, is well known for its high concentration of jobs in company management; real estate; professional, scientific and technical services; and finance and insurance.
The seven-county metropolitan area had 78,597 businesses and 1.65 million jobs through the third quarter of 2014. As such, the Twin Cities accounted for about 60 percent of total employment in the state.
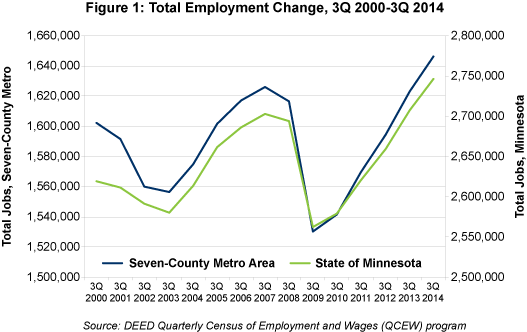
Despite a large and diverse economy, the region did not escape the effects of the Great Recession. At the pre-recession peak during third quarter 2007, Twin Cities employers reported 1.63 million jobs. Over the next two years, the region shed 95,863 jobs, a 5.9 percent employment decline that was slightly more severe than the state's 5.2 percent decrease.
Coming out of the recession, the Twin Cities regained jobs slightly faster than the rest of the state, with growth rates of 1.8 and 1.6 percent in 2011 and 2012, respectively. The region added more than 116,300 jobs between the third quarters of 2009 and 2014, a rapid 7.6 percent expansion that outpaced the state's 7.2 percent growth rate during that same period.
Overall, the Metro is 20,500 jobs above its pre-recessionary peak in 2007 and nearly 44,300 jobs above its employment level in the third quarter of 2000 (see Figure 1).

The Great Recession had a major effect in the Twin Cities, with 14 of the 20 major industrial sectors losing jobs between the third quarters of 2007 and 2009. Manufacturing was hit the hardest, shedding nearly 23,400 jobs and declining by 12.8 percent. Construction, administrative support and waste management services, and retail trade were also hit particularly hard, with each losing more than 15,000 jobs.
While these sectors made a healthy rebound between 2009 and 2014, each still has a significant way to go to catch up with pre-recessionary employment levels. For example, construction expanded by more than 18 percent during the recovery, making it one of the fastest-growing post-recession industries. Yet this sector still needs to gain over 8,700 jobs to reach its pre-recessionary peak. Similarly, manufacturing is 16,400 jobs below its pre-recessionary peak.
Unlike most sectors, both management of companies and health care and social assistance witnessed employment growth during the recession. With continued expansion through the recovery, health care and social assistance leads all sectors, with the addition of more than 40,000 jobs from 2007 to 2014. Management of companies added more than 10,100 jobs during that same time period.
Other sectors that have surpassed their pre-recession levels include accommodation and food services; professional, technical and scientific services; educational services; arts, entertainment and recreation; and public administration (see Table 1).
| Twin Cities Metro Area Industry Employment Statistics, Q3 2007-Q3 2014 | ||||||
|---|---|---|---|---|---|---|
| NAICS Industry Title | Number of Firms Q3 2014 | Number of Jobs Q3 2014 | Quarterly Payroll Q3 2014 | Recession | Recovery | Total |
| Change in Jobs Q3 2007- Q3 2009 | Change in Jobs Q3 2009- Q3 2014 | Change in Jobs Q3 2007- Q3 2014 | ||||
| Total, All Industries | 78,597 | 1,646,565 | $23,010,118,243 | -95,863 | +116,361 | +20,498 |
| Agriculture, Forestry, Fishing and Hunting | 258 | 3,174 | $22,427,177 | -90 | -123 | -213 |
| Mining | 45 | 780 | $17,328,345 | +149 | +236 | +385 |
| Construction | 6,482 | 67,692 | $1,078,690,235 | -19,275 | +10,539 | -8,736 |
| Manufacturing | 4,090 | 166,628 | $3,011,043,063 | -23,393 | +6,987 | -16,406 |
| Utilities | 80 | 6,065 | $134,074,503 | +449 | +179 | +628 |
| Wholesale Trade | 5,166 | 80,059 | $1,605,803,485 | -8,166 | +3,365 | -4,801 |
| Retail Trade | 9,051 | 160,789 | $1,179,557,928 | -15,221 | +7,398 | -7,823 |
| Transportation and Warehousing | 1,741 | 60,603 | $806,219,578 | -6,946 | +1,086 | -5,860 |
| Information | 1,388 | 39,873 | $734,528,103 | -2,160 | -2,071 | -4,231 |
| Finance and Insurance | 4,589 | 103,675 | $2,282,204,960 | -3,481 | +1,308 | -2,173 |
| Real Estate, Rental and Leasing | 3,889 | 31,233 | $445,201,939 | -2,365 | +2,958 | +593 |
| Professional and Technical Services | 10,524 | 109,511 | $2,405,422,536 | -7,645 | +13,639 | +5,994 |
| Management of Companies | 768 | 69,511 | $1,961,336,760 | +1,952 | +8,183 | +10,135 |
| Admin. Support and Waste Management Services | 3,933 | 97,697 | $852,788,340 | -17,031 | +12,752 | -4,279 |
| Educational Services | 2,023 | 106,644 | $1,224,732,046 | +4,403 | +1,247 | +5,650 |
| Health Care and Social Assistance | 7,796 | 246,071 | $2,849,639,765 | +10,614 | +29,499 | +40,113 |
| Arts, Entertainment and Recreation | 1,377 | 31,896 | $286,189,400 | +331 | +2,456 | +2,787 |
| Accommodation and Food Services | 5,664 | 131,940 | $602,872,272 | -5,487 | +11,590 | +6,103 |
| Other Services | 8,818 | 56,242 | $465,653,877 | -2,285 | +2,951 | +666 |
| Public Administration | 859 | 70,637 | $985,394,770 | -171 | +2,873 | +2,702 |
| Source: DEED Quarterly Census of Employment and Wages (QCEW) Program | ||||||
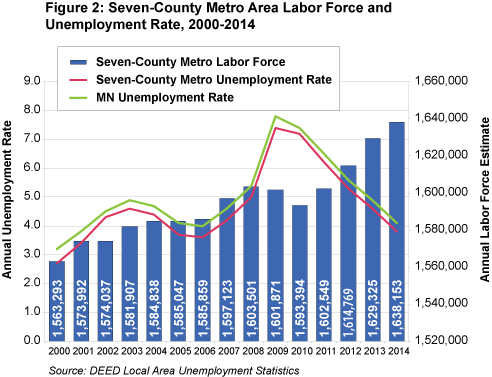
The Twin Cities Metro's labor force and unemployment levels were also affected by the Great Recession. In terms of unemployment, the region peaked out at an annual rate of 7.4 percent in 2009. This represented an estimated 119,200 unemployed workers who were actively seeking work. In the five years since, the region's unemployment has dropped back down to 3.8 percent, representing about 61,600 unemployed people, essentially cutting unemployment in half since the recession (see Figure 2).

While the size of the available labor force in the Twin Cities has fluctuated in recent years, the changes were not as large as those witnessed with employment and unemployment. With just a 0.6 percent decline in the labor force between 2008 and 2010, the overall trend has been positive, with an average annual growth rate of 0.3 percent over the last decade. Since 2010, this growth has accelerated to an annual rate of 0.7 percent.
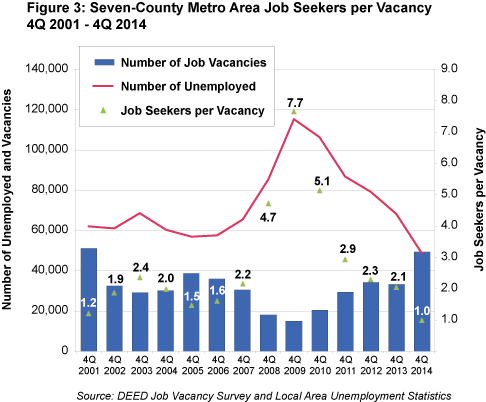
Despite the accelerated growth in the labor force since 2010, the Metro is still witnessing a tightening of the labor market. This is demonstrated by the falling ratio of job seekers to vacancies. At the height of the recession in fourth quarter 2009, there were about 7.7 job seekers per vacancy. With the plummeting unemployment rate, there was an estimated 1-to-1 ratio of job seekers to vacancies during fourth quarter 2014 (see Figure 3).

In light of these trends, employers within the Twin Cities Metro will find an increasingly competitive market for their workforce needs, while job seekers should keep an eye on growing industries and in-demand jobs.