by Luke Greiner
May 2018
More than one in six jobs in Central Minnesota is at a Health Care and Social Assistance establishment. This significant sector shapes the region’s economy, communities, and the opportunities for workers. With nearly 50,000 jobs, Health Care and Social Assistance is easily the largest industry in Central Minnesota.
In the period 2007-2017 the Health Care and Social Assistance industry grew three times faster than the overall economy in Central Minnesota at 18 percent, compared to 6 percent overall. The faster growth since 2000 has increased the share of jobs in Health Care and Social Assistance from 13 percent then to 18 percent in 2017 (see Figure 1).
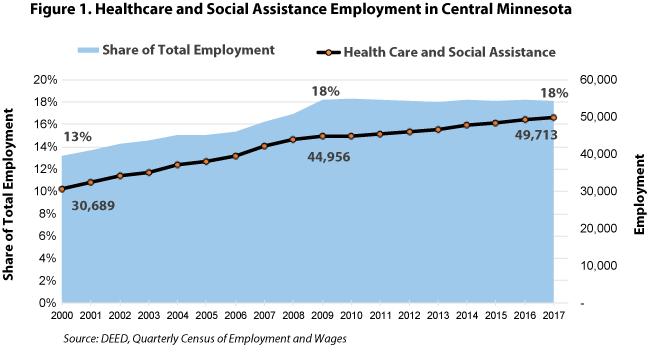
Starting in 2010, however, the rapid expansion of the Health Care and Social Assistance industry slowed to a point where it has actually lagged the overall economy in most years since with the exception of 2014 and 2016. This is a departure from statewide trends that still show Health Care and Social Assistance growing much faster than the overall economy.
Within the broad Health Care and Social Assistance industry there are four main subsectors:
The largest of the four subsectors is ambulatory healthcare services, with 14,105 jobs in 2017. Prior to 2012 hospitals had the largest number of jobs. Employment and average annual wages include many occupations at healthcare establishments that are removed from the delivery of care, such as cooks, building maintenance, grounds keeping, and housekeeping jobs.
Noteworthy is the drastically different average annual wages paid by each subsector. Both ambulatory health care and hospitals have higher than typical average wages, while nursing and residential care facilities and social assistance pay substantially less. Most of the wage differences can be attributed to the occupational mix within each industry, which will be covered in more detail later in this article.
| Table 1. Central Minnesota Healthcare and Social Assistance Employment Statistics, 2017 | ||||||
|---|---|---|---|---|---|---|
| NAICS Code | Industry | Establishments | Employment | Location Quotient | Average Annual Wage | Total Industry Payroll |
| 0 | Total, All Industries | 17,263 | 274,862 | 1.0 | $42,328 | $11,639,999,915 |
| 62 | Health Care and Social Assistance | 1,564 | 49,713 | 1.1 | $44,668 | $2,222,594,359 |
| 621 | Ambulatory Health Care Services | 765 | 14,105 | 1.0 | $60,892 | $859,425,282 |
| 6211 | Offices of Physicians | 157 | 5,240 | 0.8 | $90,792 | $475,841,609 |
| 6216 | Home Health Care Services | 50 | 2,928 | 1.2 | $25,532 | $74,845,403 |
| 6213 | Offices of Other Health Practitioners | 296 | 1,667 | 1.0 | $36,244 | $60,436,861 |
| 6212 | Offices of Dentists | 186 | 1,653 | 1.1 | $53,560 | $88,620,019 |
| 6214 | Outpatient Care Centers | 46 | 706 | 0.6 | $53,768 | $37,990,306 |
| 6219 | Other Ambulatory Health Care Services | 22 | 376 | 0.5 | $44,356 | $16,690,419 |
| 6215 | Medical and Diagnostic Laboratories | 9 | 1,533 | 4.2 | $68,744 | $105,000,665 |
| 622 | Hospitals | 32 | 13,844 | 1.1 | $58,032 | $803,961,033 |
| 623 | Nursing and Residential Care Facilities | 321 | 13,760 | 1.3 | $27,924 | $384,693,538 |
| 6231 | Nursing Care Facilities (Skilled Nursing Facilities) | 50 | 5,731 | 1.3 | $28,080 | $161,036,503 |
| 6232 | Residential Intellectual and Developmental Disability, Mental Health and Substance Abuse Facilities | 166 | 4,487 | 1.5 | $31,564 | $141,780,873 |
| 6233 | Continuing Care Retirement Communities and Assisted Living Facilities for the Elderly | 58 | 2,274 | 1.0 | $23,556 | $53,600,116 |
| 6239 | Other Residential Care Facilities | 47 | 1,268 | 1.2 | $22,308 | $28,276,046 |
| 624 | Social Assistance | 447 | 8,003 | 0.9 | $21,788 | $174,514,506 |
| 6241 | Individual and Family Services | 269 | 5,152 | 0.8 | $21,996 | $113,527,333 |
| 6244 | Child Day Care Services | 130 | 1,569 | 1.0 | $18,148 | $28,514,826 |
| 6243 | Vocational Rehabilitation Services | 27 | 1,096 | 0.9 | $25,220 | $27,635,709 |
| 6242 | Community Food and Housing, and Emergency and Other Relief Services | 21 | 185 | 0.6 | $26,104 | $4,836,638 |
| Source: DEED, QCEW | ||||||
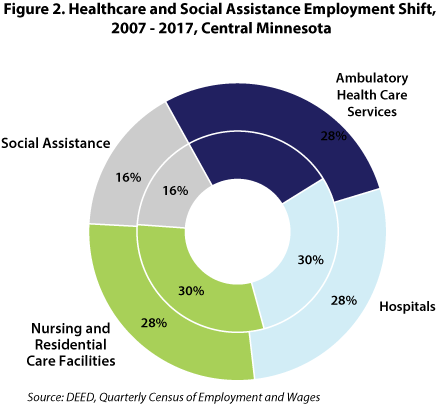
Digging deeper into the industry reveals a shift occurring within the broad industry that is changing the future of health care. Since the slower growth trend started in 2011 for the overall Health Care and Social Assistance industry, the ambulatory health care services component grew 28.4 percent while nursing and residential care employment actually declined slightly, down 0.1 percent. Hospital employment also had lackluster employment growth at just 3.2 percent while social assistance grew a more typical 11.5 percent. In comparison, the overall economy grew jobs by 10.1 percent from 2011 to 2017.
Figure 2 illustrates how this shift in the location of jobs within the broader health care and social assistance industry is a direct reflection of the changing delivery of care. The rising costs of delivering care coupled with changing care practices is reflected by the decreasing share of employment at hospitals being offset by an increasing share in the ambulatory health care services sector. The slight decline in nursing and residential care facilities employment pushed its share of employment in the industry down two points from 2011 to 2017.
The shift in industry employment has a direct impact on the types of occupations health care providers need to fill. For instance, the shift from hospital employment to ambulatory health care services will change the needs of healthcare employers, potentially impacting existing education systems. According to DEED's occupational staffing patterns data, roughly 30 percent of jobs at hospitals are registered nurses (RNs) while less than 8 percent of jobs in ambulatory health care services are RNs. So a migration of employment and services from hospitals to ambulatory health care services could signal a decrease in the future demand for RNs. However, things do not stay constant, and it's possible that the ambulatory health care services industry will need an increasing share of RNs to provide services that were historically provided by hospitals.
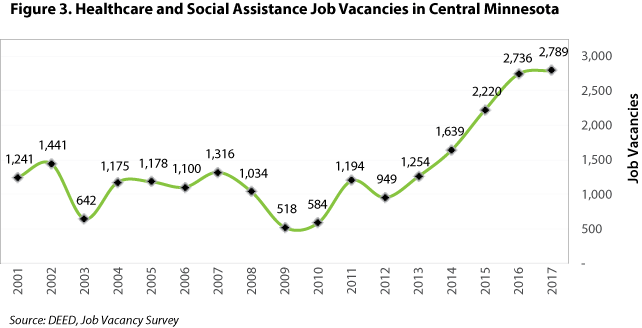
Job vacancy data also seem to point to large numbers of openings for occupations that are less common at hospitals. With almost 2,800 job openings in 2017, the Health Care and Social Assistance industry has twice as many openings compared to the historical norms (see Figure 3).
The most common healthcare opening is the personal care aide (PCA), with an average of 721 openings during 2017. Job vacancy data are collected during the second and fourth quarter, so averaging the median wage offer for the two quarters provides a typical starting wage of $11.47 per hour for PCAs, lower than the $13.82 median wage offer that's offered for all jobs in the area. About 28 percent of jobs in the social assistance industry are PCAs, making it the largest occupation in the subsector.
Another occupation with large numbers of vacancies is the certified nursing assistant (CNA), with almost 300 openings and an average median wage offer at $12.98 per hour. CNAs are the most common occupation at nursing and residential care facilities, accounting for 24 percent of all jobs in the subsector. Other occupations with many current job postings include RNs, licensed practical nurses (LPNs), and home health aides (HHAs), which are all employed in large numbers in multiple subsectors.
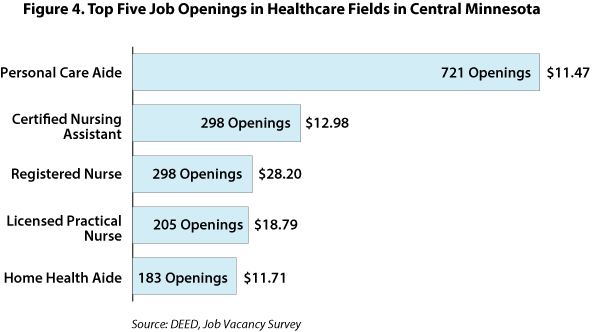
Opportunity abounds in health care for potential workers without a bachelor's degree. In fact, none of the top five occupations with the most openings require education beyond an associate's degree, despite accounting for roughly 58 percent of openings in the Health Care and Social Assistance industry. Only RN positions require a two- year associate degree, while CNAs and LPNs typically require vocational training, and PCA and HHA positions can be attained with a high school diploma or less.
The varying amount of educational requirements in the top five occupations with the most openings provide excellent ramps to move up the career ladder or laterally to explore different fields within the industry.
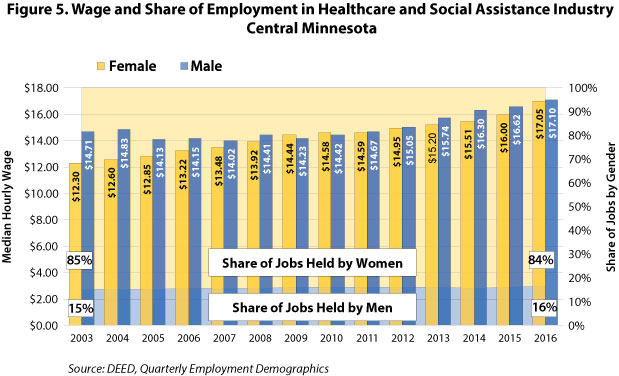
The Health Care and Social Assistance industry is notoriously female dominated, more so than any other industry in Central Minnesota. Almost 85 percent of jobs in Health Care and Social Assistance are held by women. Men have been filling a larger share of jobs over time, but the rate of change is incredibly slow, amounting to a single point increase in the 13 years from 2003 to 2016. At that rate of change it would take 421 years to reach the ratio found in the region's overall economy (48.4% male and 51.6% female).
The occupations commonly pursued and held by men and women influence not only the share of employment for each gender, but also wages. While women have been the primary workers in Health Care and Social Assistance, the median hourly wage for men has been higher. The gap was 20 percent in 2003 but nearly reached parity by 2008. Most recently jobs held by men had median hourly wages that were only 0.3 percent more than jobs held by women.
Keep in mind that this is not comparing the same occupation, but reflects the median wage – 50 percent earn more, and 50 percent earn less – for all workers in the industry. For instance, 87 percent of lower-paying nursing, psychiatric, and home health aide jobs are held by women, but only 40 percent of higher-paying physician jobs are held by females. The large differences in the amount of jobs held by each gender and their respective wages explain a significant amount of the wage gap. Thus, the wage parity occurring could be from more women pursuing higher paid occupations like physicians, or it could be from men holding larger numbers of lower paid occupations such as PCAs, HHAs, or CNAs, or some combination of both scenarios (see Figure 5).
In conclusion, the Health Care and Social Assistance industry has an abundance of job openings at varying education levels. The shift within healthcare is placing high demand on a few select occupations with large numbers of openings. In spite of a finite amount of available labor, recruiting more men into healthcare occupations could not only help ease the difficulty in filling some of the most prevalent types of job openings, but would also better reflect the population that Health Care and Social Assistance organizations serve.