by Cameron Macht
March 2018
After experiencing a loss of just over 3,400 people since 2010, Southwest Minnesota is now home to about 392,000 residents. Although the 23-county planning region enjoyed a natural increase – more births than deaths – of 6,300 people, Southwest Minnesota suffered domestic out-migration of 13,750 people who left the region to live in other states. Lost in the shadow of that outflow, however, was the region's international net in-migration of nearly 4,000 additional foreign-born Minnesotans, which helped offset some of the domestic losses (see Table 1).
| Table 1. Cumulative Estimates of the Components of Population Change in Southwest Minnesota,. 2010-2017 | |||||||
|---|---|---|---|---|---|---|---|
| 2017 Population Estimate | 2010-2017 Estimated Population Change | April 1, 2010 to July 1, 2017 | |||||
| Vital Events | Net Migration | ||||||
| Natural Increase | Births | Deaths | Total | International | Domestic | ||
| 392,228 | -3,415 | 6,319 | 34,048 | -27,729 | -9,774 | 3,968 | -13,742 |
| Source: U.S. Census Bureau, Population Estimates Program | |||||||
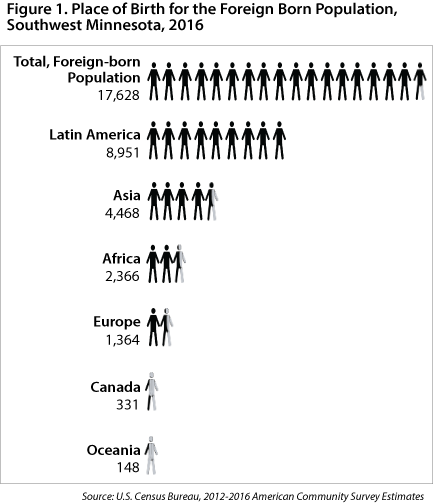
Southwest Minnesota is now home to 17,628 foreign-born residents or about 4.5 percent of the total population according to the U.S. Census Bureau's American Community Survey. The number of immigrants in the region increased by 22.1 percent from 2010 to 2016, outpacing the statewide growth rate of 16.3 percent.
Over half (8,951 people) of the region's total foreign-born population is from Latin America, including 5,181 people from Mexico. Southwest Minnesota gained 1,456 additional residents from Latin America between 2010 and 2016, a 19.4 percent increase, which was also the largest numeric gain to what was already the region's largest immigrant population. More specifically, that included a gain of 237 additional people from Mexico, but also huge influxes from Guatemala, El Salvador, and Honduras.
The second largest number of foreign-born residents in the region were from Asia, accounting for one in every four immigrants. Most of these immigrants (2,582 people) came from Southeast Asia, including more than 950 people from Laos and about 580 people from Thailand, while 975 people were from Eastern Asia, including China and Korea.
The fastest-growing wave of new immigrants to Southwest Minnesota came from Africa, rising by just over 1,000 people from 2010 to 2016, a 74 percent jump, pushing the region's African population to 2,366 people. The largest contingent is from Eastern Africa, primarily Somalia, which surpassed 1,725 people in 2016 after rising nearly 145 percent since 2010.
Another 1,364 foreign-born residents were from Europe, actually a slight decline compared to 2010. Southwest Minnesota also saw a drop in the number of immigrants from Canada from 2010 to 2016, now just 331 people (see Figure 1).
Based on year of entry, Southwest Minnesota's foreign-born population was "newer" than the rest of the state and the nation. Just under 20 percent of the region's immigrants entered the U.S. since 2010 and another 36.7 percent entered since 2000, compared to 17.7 and 35.4 percent statewide, respectively. The remaining 43.6 percent of immigrants in the region settled in the U.S. prior to 2000.
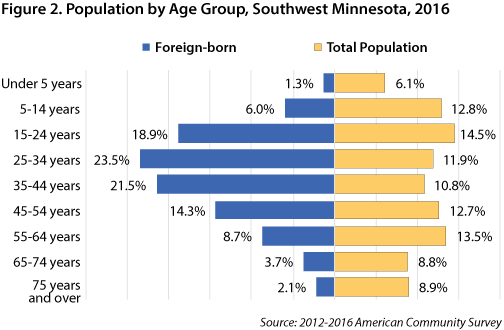
Not surprisingly, immigrants have a much younger age profile than the native-born population in the region. In 2016 about 60 percent of the foreign-born population was between 25 and 54 years old, compared to just 35.3 percent of the total population. Almost one in every four (23.5 percent) immigrants in the region was between 25 and 34 years of age, nearly double the share in the region's total population. In contrast, less than 6 percent of the region's foreign-born population was 65 years or over, compared to 17.7 percent of the total population (see Figure 2).
With such a large percentage of the population in their prime working years, immigrants have become increasingly important contributors to the local economy. Statewide 72.1 percent of the foreign-born population aged 16 years and over was actively participating in the labor force, which was actually higher than the native-born population (69.6 percent). Applying the region's labor force participation rates by age group to the region's foreign-born population would equal just over 12,800 available immigrant workers, comprising about 6 percent of Southwest Minnesota's workforce.
Southwest Minnesota averaged a net gain of just under 2,400 additional labor force participants per year between 1990 and 2001, and as a result employers were able to tap into a large and growing pool of workers. However, from 2001 to 2017 Southwest Minnesota's labor force began to shrink, losing almost 2,750 workers. The region peaked with 225,616 available workers in 2009, but dropped to 221,527 workers in 2017.
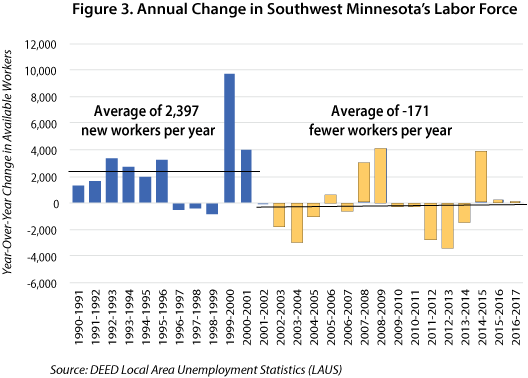
Recently released labor force projections from the Minnesota State Demographic Center suggest this trend will become even more apparent in the years ahead, with Southwest Minnesota expected to lose another 8,345 workers between 2020 and 2030. If the projections hold true, it will be even more challenging for employers to fill jobs and grow, but the situation will also shine a light on the importance of immigration to the economy.
While the region's overall labor force was shrinking, the number of immigrant workers in the region increased by more than 2,000 workers from 2010 to 2016. But Southwest Minnesota's native born workforce was aging and declining, creating an extremely tight labor market in the region. According to DEED's unemployment statistics and job vacancy data, there was now less than one available jobseeker per vacancy in the region, the lowest level recorded in the past 10 years.
Although willing and able to work, some of this group of newly arrived workers may have to overcome some barriers to employment. About 85 percent of immigrants in Southwest Minnesota reported speaking another language, but many of them also had some ability to speak English. Two-thirds (65.5%) reported being able to speak English "well" or "very well", while the others spoke English "not well" or "not at all."
Depending on the demands of the jobs they are hiring for, employers may have a hard time integrating the more than 5,000 foreign-born residents in the region who don't speak English or don't speak it well. Several Southwest Minnesota companies, however, have developed successful strategies for recruiting, hiring, training, and retaining workers who speak another language, quickly deepening their potential pool of applicants.
Immigrants wanting to learn or improve their English can tap into the network of Adult Basic Education (ABE) services in the region, which teach English as a Second Language classes from the pre-literacy to advanced levels. These classes help students develop speaking, listening, reading, and writing skills in order to communicate effectively and function successfully within their workplaces, communities, and families.
According to their website, "Southwest ABE prioritizes the goal of assisting students in gaining skills to obtain meaningful employment. Southwest ABE sees the priority of employment training as the most effective means of assisting our students in all areas of their lives." ABE also provides workforce preparation skills and a Transition Into Employment program, as well as citizenship and civics education.
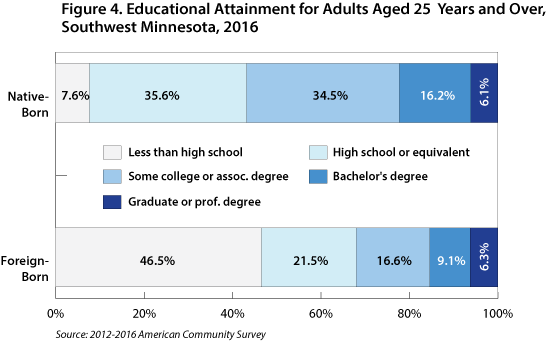
In addition to language barriers, Census data show that many foreign-born residents could benefit from ABE's adult diploma and GED programs, designed to provide students with the equivalency of a high school diploma. Over two-thirds (68.0%) of foreign-born residents aged 25 years and over in the region had a high school diploma or less (see Figure 4). Immigrants with less than a high school diploma may need access to education to be prepared for the workforce, where jobs for high school graduates are in high demand. However, it's also important to note that a slightly higher percentage of foreign born than native born adults in the region had graduate or professional degrees, helping to fill other high demand openings in health care and computer-related fields.
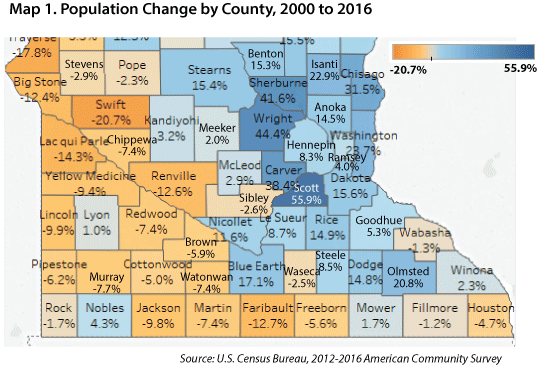
Beyond just the workforce, these demographic shifts are also changing the faces of the population in the region. Most counties in the region were home to an aging and declining population, though there were notable exceptions. Blue Earth County, where Mankato is located, was the 10th fastest growing county in the state from 2000-2016, and Nicollet County, the other portion of the Mankato-North Mankato metropolitan statistical area, ranked 23rd.
Likewise, Le Sueur, Nobles, and Lyon counties also saw population growth this century, while the remaining 18 counties in the region saw various amounts of population loss. Fifteen of the 26 fastest-declining counties in the state were found in Southwest Minnesota (see Map 1).
Despite the population declines overall, data from the Census Bureau show that Southwest Minnesota's population was growing more diverse, with the number of residents from different minority groups and ethnicities increasing rapidly since 2000. While the number of white residents dropped by 2.8 percent, representing a loss of 10,671 people, the number of people of immigrant groups rose significantly.
The number of black or African American residents more than doubled in Southwest Minnesota from 2000-2016, a gain of 3,870 people. The region also added 2,260 Asian residents, almost 2,000 more people of two or more races, and over 600 additional American Indian or Alaska Natives. The region saw a small decline in the number of people of some other race, although there were still about 6,325 people in that category, making it about the same size as the region's black and Asian populations.
The region's Hispanic or Latino population nearly doubled to more than 24,000 people through 2016, accounting for about 6.1 percent of the region's total population. Southwest Minnesota has a higher share of Hispanic or Latino residents than the state (see Table 2).
| Table 2. Race and Hispanic Origin, 2016 | |||||
|---|---|---|---|---|---|
| Southwest Minnesota | Minnesota | ||||
| Number | Percent of Total | Change from 2000-2016 | Percent of Total | Change from 2000-2016 | |
| Total | 392,479 | 100.0% | -0.5% | 100.0% | 10.8% |
| White | 365,148 | 93.0% | -2.8% | 84.3% | .5% |
| Black or African American | 6,573 | 1.7% | 43.2% | 5.7% | 1.0% |
| American Indian and Alaska Native | 2,593 | 0.7% | 0.7% | 1.0% | 3.5% |
| Asian and Other Pacific Islander | 6,567 | 1.7% | 2.5% | 4.6% | 72.8% |
| Some Other Race | 6,325 | 1.6% | -0.6% | 1.6% | 34.2% |
| Two or More Races | 5,273 | 1.3% | 7.7% | 2.7% | 79.5% |
| Hispanic or Latino origin | 24,118 | 6.1% | 93.7% | 5.1% | 92.5% |
| Source: U.S. Census Bureau, 2012-2016 American Community Survey | |||||
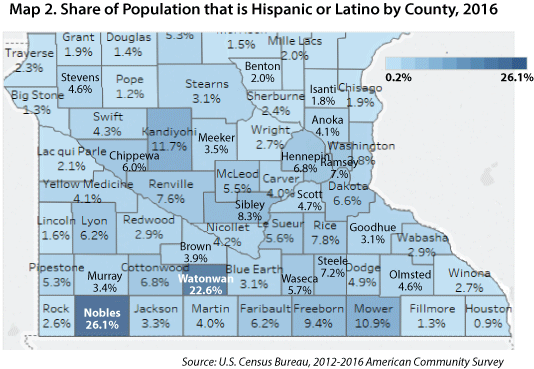
Southwest Minnesota is home to the two counties with the highest percentage of Hispanic or Latino residents in the state: Nobles (26.1%) and Watonwan (22.6%). In addition, the region has 10 of the 22 counties with the highest share of Hispanic or Latino residents in the state (see Map 2).
Wherever they live or work, these diverse populations are providing a new source of growth to Southwest Minnesota. The region's immigrants and residents of other races have shown themselves to be ready and willing contributors, with high and rising labor force participation rates. While some have educational and language barriers for certain jobs, a variety of occupations, including many that are already in critical need of workers, have immigrants already contributing in significant numbers.