

by Carson Gorecki and Cameron Macht
June 2024
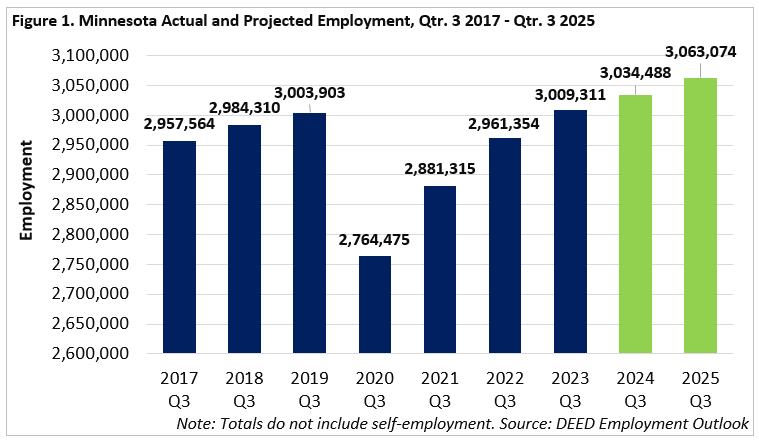
The latest employment projections produced by DEED's Labor Market Information Office estimate a gain of 56,225 jobs over the next two years. That addition equates to a growth rate of 1.8% between the base period of third quarter 2023 to third quarter 2025, or average employment growth of 0.9% per year. Moving forward, projected growth is more in line with typical economic expansion seen prior to the onset of the pandemic (see Figure 1).
These short-term projections predict a slow-down from the more rapid employment growth seen since 2020 as the economy recovered from the Pandemic Recession. From 2021 to 2023, the state added almost 128,000 jobs and grew 4.6%, though each year showed slower growth as the economy closed in on pre-pandemic employment levels. The one-year growth rate from 2022 to 2023 was 1.6%. In the two years from 2017 to 2019, total state employment grew 1.6%, with 46,300 jobs added. The slowing growth rates represent a slowing recovery and are informed by demographic and labor force constraints.
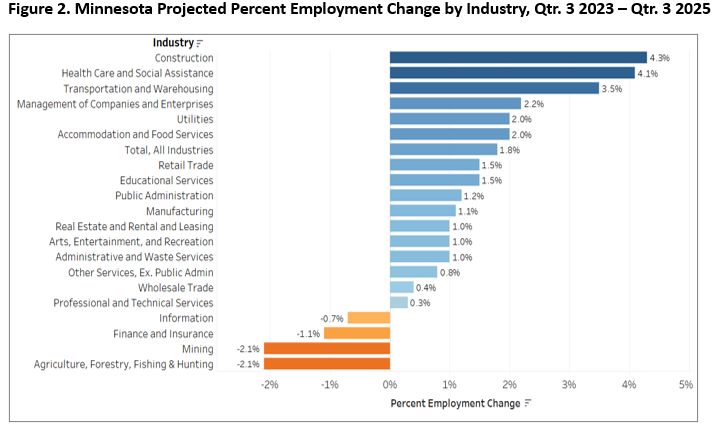
Construction, Health Care & Social Assistance, and Transportation & Warehousing are the sectors expected to see the fastest employment growth over the next two years. Boasting 4.4% employment growth from 2019 to 2023, Construction was one of the few sectors that fared relatively well over the pandemic period. That trend is expected to continue under historic infrastructure investments from state and federal governments.
In contrast, Minnesota witnessed a notable decline in employment within the Health Care & Social Assistance sector during the Pandemic Recession. Employment growth in the sector picked up again more recently despite the enduring effects of the pandemic that continue to influence employment patterns within this sector. Benefiting from their close connections to goods-producing sectors like Construction as well as changing preferences and practices in e-commerce and shipping, Transportation & Warehousing rebounded relatively quickly after a 2020 decline, averaging 4.1% employment growth from 2020 to 2023 (see Figure 2).
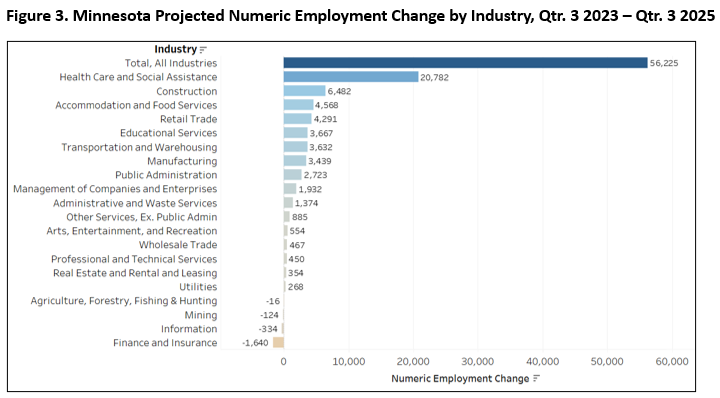
After averaging a pandemic-related employment decline from 2019 to 2022, Health Care & Social Assistance returned to robust annual growth of 3.9% into 2023. Already the largest industry in the state, Health Care & Social Assistance alone is expected to account for over a third (20,782) of all projected job gains (see Figure 3).
Other sectors that are projected to have above average employment growth through 2025 include Management of Companies, Utilities, and Accommodation & Food Services. The latter was one of the hardest hit sectors during the pandemic (-24.6% from 2019 to 2020), but has also seen some of the highest percent employment growth since 2020, expanding 27.6% over three years. Even with continued projected growth, the Accommodation & Food Services sector is not expected to regain pre-pandemic levels yet for several years.
Four sectors were projected to decline over the short-term forecast period, including Information, Finance & Insurance, Mining, and Agriculture, Forestry, Fishing, & Hunting. Information is expected to continue its long-term decline, while Finance & Insurance has only recently seen employment losses after expanding relatively consistently coming out of the Great Recession. Mining, a notoriously difficult sector to predict, has oscillated between growth and decline for the past five years. The sector remains slightly below pre-pandemic levels and 9.5% below the most recent employment peak in 2014. Still, projected declines amount to just over 120 jobs for the small sector. Similarly, the relatively small Agriculture, Forestry, Fishing & Hunting sector has seen fluctuations, but long-term growth overall.
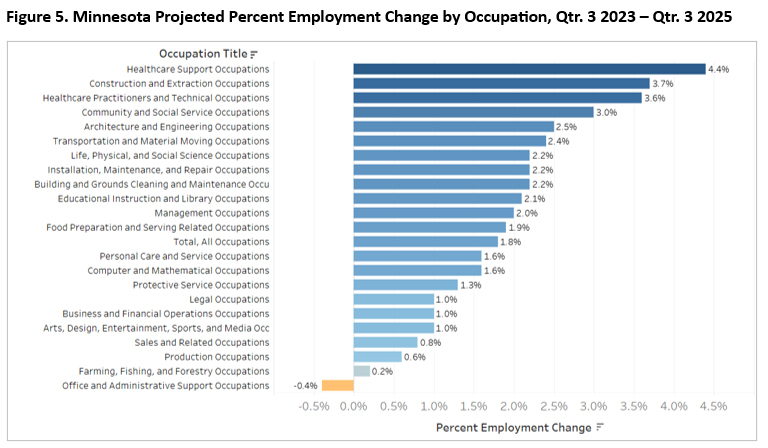
The trends in the industry projections are also evident in the short-term employment projections by occupational group. Healthcare Support (+4.4%) and Healthcare Practitioners & Technical (+3.6%) occupations were in the top three, along with the Construction & Extraction occupational group (+3.7%). Unsurprisingly, the two Healthcare occupational groups display the most projected job additions, combining for almost 15,000 new jobs between them (see figure 4). The projected fourth (Community & Social Service) and fifth (Architecture & Engineering) fastest occupational groups are also closely tied to the top three industries of growth.
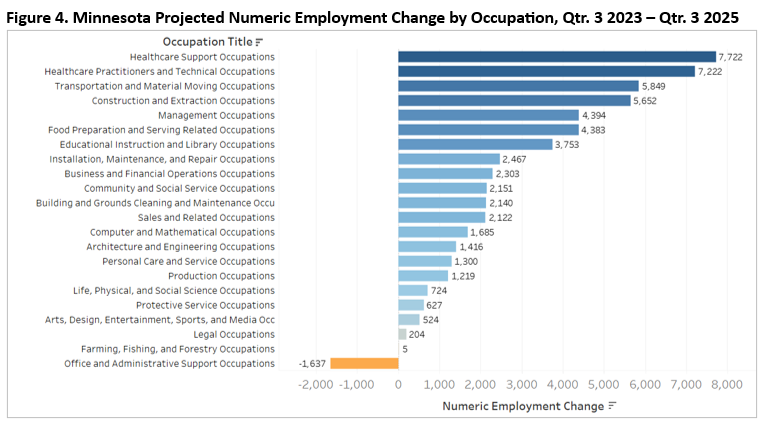
Interestingly, there were many more occupational groups (12 out of 22) projected to have above-average growth than industry sectors (6 out of 20). This phenomenon demonstrates how occupations are unevenly distributed across industries. For example, the only occupational group projected to decline is Office & Administrative Support (-0.4%). Most industries contain some form of Office Clerks, Secretaries, Bookkeeping, Accounting, & Auditing Clerks, and Customer Service Representatives, which are the most common Office & Administrative Support occupations. However, these occupations also have a higher share of repetitive tasks making them more susceptible to automation (see Figure 5).
At a more detailed level, nine of the 20 occupations projected to grow the fastest are in or closely related to the two Healthcare occupational groups. Nurse Practitioners is expected to grow fastest, adding 615 new positions, or nearly 11% in just two years. The occupation expected to grow second fastest is Wind Turbine Service Technicians. While relatively small with under 300 jobs, the role is projected to grow rapidly as demand for carbon free sources of energy production rises. According to the U.S. Wind Turbine Database, Minnesota is already home to over 2,700 wind turbines, which is eighth most among states.
Transportation & Material Moving occupations accounted for an additional three in the top 20, but were varied. Employment for Taxi Drivers may appear low, but that is likely because more rideshare drivers are now technically self-employed and contracted via companies like Lyft and Uber, and therefore do not show up in covered employment estimates. Flight Attendants show up because of a spike in air travel, while Crane & Tower Operators are expected to grow due to the growth in the Construction industry.
On that note, Construction & Extraction and Computer & Mathematical counted for another two occupations each among the top 20. With all of the highway, street and bridge construction projects scheduled for the next five years, this includes Paving, Surfacing & Tamping Equipment Operators and Operating Engineers & Other Construction Equipment Operators. Demand for Information Technology services, and more notably, analytics, remains high in Minnesota, with Statisticians and Data Scientists both in the top 15 (see Table 1).
| Table 1. Employment Growth by Occupation in Minnesota, Qtr. 3 2023 to Qtr. 3 2025 | ||||
|---|---|---|---|---|
| Occupation Title | Qtr. 3 2023 Base Employment | Qtr. 3 2025 Projected Employment | Percent Change | Numeric Change |
| Nurse Practitioners | 5,745 | 6,360 | +10.7% | +615 |
| Wind Turbine Service Technicians | 261 | 287 | +10.0% | +26 |
| Taxi Drivers | 617 | 673 | +9.1% | +56 |
| Physician Assistants | 3,935 | 4,256 | +8.2% | +321 |
| Epidemiologists | 357 | 385 | +7.8% | +28 |
| Medical & Health Services Managers | 10,709 | 11,486 | +7.3% | +777 |
| Paving, Surfacing, & Tamping Equipment Operators | 1,221 | 1,305 | +6.9% | +84 |
| Orthotists & Prosthetists | 337 | 360 | +6.8% | +23 |
| Physical Therapist Assistants | 1,201 | 1,278 | +6.4% | +77 |
| Occupational Therapy Assistants | 641 | 681 | +6.2% | +40 |
| Flight Attendants | 2,720 | 2,882 | +6.0% | +162 |
| Statisticians | 991 | 1,048 | +5.8% | +57 |
| Health Information Technologists & Medical Records Technicians | 966 | 1,020 | +5.6% | +54 |
| Data Scientists | 1,682 | 1,775 | +5.5% | +93 |
| Diagnostic Medical Sonographers | 1,719 | 1,813 | +5.5% | +94 |
| Substance Abuse, Behavioral Disorder & Mental Health Counselors | 7,810 | 8,225 | +5.3% | +415 |
| Cooks, Restaurant | 27,912 | 29,397 | +5.3% | +1,485 |
| Crane & Tower Operators | 229 | 241 | +5.2% | +12 |
| Speech-Language Pathologists | 3,131 | 3,290 | +5.1% | +159 |
| Operating Engineers & Construction Equipment Operators | 8,934 | 9,393 | +5.1% | +459 |
| Source: DEED Employment Outlook | ||||
There are about 90 occupations projected to have a negative percent employment change over the two years. One third of these are Production occupations and just under another third are Office & Administrative Support occupations. Many of these occupations have repetitive tasks that are more easily automatable, such as assembly, data entry, typing, file organization, and certain customer service duties. Reflecting this, the five occupations expected to decline the fastest are Word Processors & Typists (-7.7%), Tellers (-6.9%), New Accounts Clerks (-6.9%), Telemarketers (-4.9%), and Data Entry Keyers (-4.8%).
By the education or training typically needed to enter an occupation, most jobs (61%) in Minnesota require a high school diploma equivalent or below. Collectively, the jobs requiring the lowest levels of education are projected to grow the slowest. However, given the sheer number of jobs in that category, demand will remain due to openings created by retirements and occupational transfers (see Table 2). Occupations in this group expected to grow the fastest represent diverse fields as mentioned earlier, including Taxi Drivers, Paving, Surfacing, & Tamping Equipment Operators, Flight Attendants, Restaurant Cooks, and Crane Operators and Operating Engineers & Other Construction Equipment Operators.
By educational requirements, the occupations expected to grow the fastest are those typically requiring some form of graduate-level education. While only 4% of jobs in 2023 typically required a graduate degree, that share is projected to grow over the next two years. Of occupations requiring graduate-level training expected to grow the fastest, many are in the Healthcare Practitioners & Technical occupational group. The top five include Nurse Practitioners, Physician Assistants, Epidemiologists, Orthotists & Prosthetists and Statisticians. Occupations requiring graduate degrees have the smallest share of openings created by workers transferring to other fields, reflecting how a bigger investment in education may have an anchoring effect.
The group expected to grow second-fastest are those typically asking for vocational training, usually in the form of apprenticeships or formal structured on-the-job training programs. Traditionally, this category included many occupations in the trades, but has started to expand into all kinds of work including Healthcare and Manufacturing. Wind Turbine Service Technicians, Avionics Technicians, Health Information Technologists, Ophthalmic Medical Technicians, Medical Assistants, and Electricians are the occupations in this group expected to see the fastest growth (greater than 4.8% over two years).
| Table 2. Minnesota Employment Projections by Typical Educational Requirement, Qtr. 3 2023 – Qtr. 3 2025 | |||||||
|---|---|---|---|---|---|---|---|
| Typical Education Required | Percent of Occupations | Percent of Total Qtr. 3 2023 Employment | Projected Numeric Change | Projected Percent Change | Labor Market Exit Openings | Transfer Openings | Total Openings |
| High School or Less | 53% | 61% | +23,947 | +1.3% | +204,314 | +256,441 | +484,702 |
| Bachelor's Degree | 22% | 24% | +13,823 | +1.9% | +42,340 | +63,799 | +119,962 |
| Vocational Training | 5% | 6% | +4,992 | +2.9% | +15,160 | +20,130 | +40,282 |
| Associate degree | 6% | 5% | +3,696 | +2.6% | +10,056 | +10,450 | +24,202 |
| Graduate Degree | 13% | 4% | +4,269 | +3.2% | +7,355 | +6,606 | +18,230 |
| No Typical Education | 0% | 0% | +33 | +1.3% | +197 | +284 | +514 |
| Source: MN DEED Employment Outlook, Education Requirements for Occupations | |||||||
Occupations requiring associate degrees are also expected to grow faster than average over two years. The occupations in this group with the highest projected percent employment growth include several Healthcare roles like Physical Therapist Assistants, Occupational Therapy Assistants, Diagnostic Medical Sonographers, Respiratory Therapists and Community Health Workers. In addition to Healthcare, several Architecture & Engineering, and Life, Physical & Social Science occupations are also represented among the fastest growing. Occupations typically requiring associate degrees have the largest share of projected new openings created from labor market exits.
Occupations typically needing bachelor's degrees represent the second largest share (24%) of jobs, behind only those requiring a high school diploma or less. Occupations requiring a bachelor's are projected to grow just above the overall average. Among those projected to grow the fastest are again often related to Healthcare: Medical & Health Services Managers, Substance Abuse, Behavioral Disorder & Mental Health Counselors, Exercise Physiologists and Athletic Trainers. Beyond Healthcare occupations there is a good variety of occupations including Data Scientists, Preschool Teachers, Construction Managers and Logisticians. Occupations requiring bachelor's degrees are tied with those requiring high school or less for the highest share of openings projected to be created by occupational transfers.
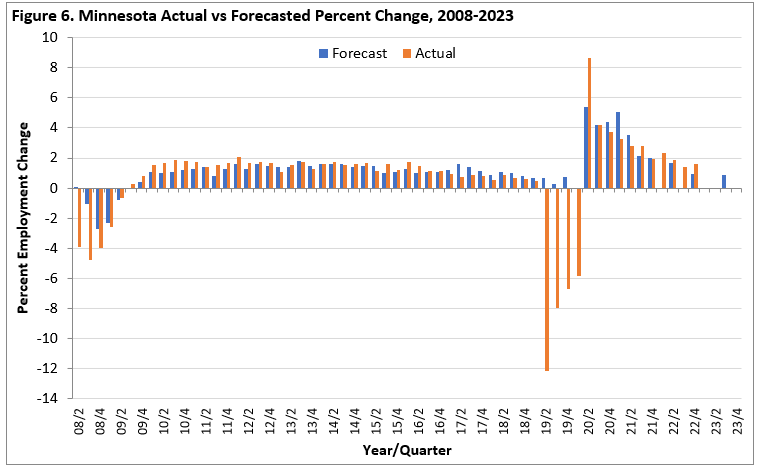
Employment projections are a tricky business. Despite using the best information and methods available, they are still educated guesses and can at times miss the mark. For example, in 2018 and 2019 we had no idea that a global pandemic that would lead to an abrupt loss of tens of thousands of jobs was on the horizon. Our projections are much better at predicting how a current trend will evolve, accelerate, or change. For this reason, our two-year forecasts tend to perform better in periods of consistent decline or growth, such as the decade leading out of the Great Recession (see Figure 6). Sudden turns (switching from employment growth to decline or vice versa) in the trajectory are trickier to predict and may take a couple projection periods to re-adjust to the change in direction.
You can see this difficulty in capturing directional change in the comparison between projected and actual percent employment change in the period beginning with second quarter 2019 and ending in fourth quarter 2019. Each of those projections were created before we knew about the impact of COVID. When it was time to create the projections with a base period in first quarter 2020, uncertainty reigned. When we projected in the second quarter of 2020, the recovery had already begun, and then it was a matter of how fast and for how long. We initially underestimated, and then overestimated the rate of recovery as the economy suffered a historic loss followed by an unprecedented rebound.
In sum, DEED's Labor Market Information office anticipates Minnesota will gain 56,225 jobs over the next two years, marking a 1.8% growth rate, reminiscent of pre-pandemic economic growth trends. Sectors like Construction, Health Care & Social Assistance, and Transportation & Warehousing are poised for notable employment increases, driven by historic infrastructure investments and evolving consumer behaviors post-pandemic.
However, challenges remain in accurately predicting employment trends, as evidenced by the unpredictable impact of the COVID-19 pandemic. While projections provide valuable insights, their accuracy can be influenced by unforeseen events, underscoring the complexity of forecasting in a dynamic economic landscape. Even if not perfect, forecasts offer valuable guidance for understanding and adapting to evolving labor market dynamics, particularly in navigating periods of significant change.