by Dave Senf
March 2016
The significance of Minnesota's high concentration of Fortune 500 companies is backed up by employment and wage numbers.
Minnesotans have been known to brag about the unusually high concentration of Fortune 500 companies headquartered in the state.1 Soon after the Fortune 500 ranking (which is based on revenues) is published each year, local business media scrutinize the list and report on where Minnesota stands.
Minnesota's big headquarters ranking has moved up and down a few spots over the years, but the state has remained in or near the top 10 for over six decades. The state had 17 companies on the list last year, tied with Connecticut for 11th nationally. On a per capita basis, however, Minnesota ranked second in 2015 behind Connecticut.2
Minnesota's high share of corporate headquarters spans a diverse set of industries, including manufacturing (3M, St. Jude Medical, General Mills and Hormel), financial activities (UnitedHealth Group, U.S. Bancorp, Ameriprise Financial and Thrivent Financial), wholesale and retail trade (Supervalu, Target and Best Buy), energy (Xcel Energy) and transportation (C.H. Robinson). The state's mix of Fortune 500 companies is often cited as one of the key drivers in the state's economic success and the reason for Minnesota's relatively quick rebound from the Great Recession.
We know these companies are major contributors to the state economy, but just how much do they contribute to Minnesota's employment and wage income? The Fortune list provides employment totals for each company, but those figures are for worldwide employment.
The state's Fortune 500 companies employ many Minnesotans, but their combined state workforce is a fraction of the 1 million combined worldwide workforce published by Fortune. Employment at their corporate offices is even smaller.
As long as no disclosure problems pop up,3 tracking employment at Minnesota's Fortune 500 headquarters should be relatively easy, using the North American Industrial Classification System (NAICS). NAICS 55 (Management of Companies and Enterprises) comprises management-related employment across all industries. Within that classification, NAICS 551114 (Corporate, Subsidiary and Regional Managing Offices) accounted for 84 percent of the sector's 1,323 establishments in Minnesota and 97 percent of the sector's 78,432 jobs in the state during the first quarter of 2015.4
Table 1 displays the number of establishments, employment and wage payments for Minnesota's NAICS 55 sector by establishment size. Establishment size refers to the number of employees. Fourteen establishments with workforces of more than 1,000 employed 36,000 workers and paid out $1.5 billion in wages during the first quarter last year in Minnesota.5 Their employees represented 1.6 percent of Minnesota private employment and 4.6 percent of private wage income paid in the state during first quarter 2015. The 4.6 percent of wages is more than double the 1.6 percent of employment. The annual average wage for NAICS 55 sector jobs was $146,000 compared with $57,600 across all private jobs last year.
| 2015 Minnesota NAICS 55 Sector - Management of Companies and Enterprises, 1st Quarter 2015 | ||||||
|---|---|---|---|---|---|---|
| Size of Establishment | 2015 Establishments | 2015 Employment | 2015 Wage Payments (Millions of dollars) | Percent of Minnesota Private Establishments | Percent of Minnesota Private Jobs | Percent of Minnesota Private Wage Payments |
| Total | 1,323 | 78,432 | 2,863 | 0.8 | 3.4 | 8.6 |
| Fewer than 5 employees | 651 | 930 | 29 | 0.4 | 0.0 | 0.1 |
| 5 to 9 employees | 186 | 1,268 | 34 | 0.1 | 0.1 | 0.1 |
| 10 to 19 employees | 140 | 1,951 | 54 | 0.1 | 0.1 | 0.2 |
| 20 to 49 employees | 145 | 4,499 | 124 | 0.1 | 0.2 | 0.4 |
| 50 to 99 employees | 81 | 5,837 | 176 | 0.1 | 0.3 | 0.5 |
| 100 to 249 employees | 72 | 10,816 | 393 | 0.0 | 0.5 | 1.2 |
| 250 to 499 employees | 19 | 6,633 | 258 | 0.0 | 0.3 | 0.8 |
| 500 to 999 employees | 15 | 10,477 | 268 | 0.0 | 0.5 | 0.8 |
| 1,000 or more employees | 14 | 36,021 | 1,528 | 0.0 | 1.6 | 4.6 |
| Source: 1st Quarter, 2015 Quarterly Census of Employment and Wages (QCEW) | ||||||
The mix of headquarters jobs is skewed toward high-paying occupations like management; business and financial operations; and computers and mathematics. Those three major occupational groups account for 54 percent of all jobs in the NAICS 55 sector in Minnesota but only 16 percent across all private employment.
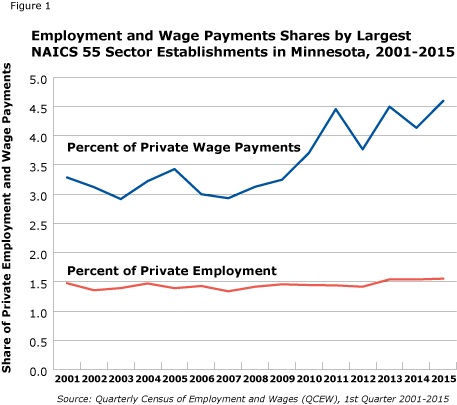
As shown in Figure 1, employment at the largest NAICS 55 establishments has hovered around 1.5 percent of total private Minnesota employment over the last 15 years. The share of wage payments, however, climbed significantly during the six-year recovery, jumping from 3.2 percent in 2009 to 4.6 percent in 2015.

Employees at large corporate headquarters have enjoyed significantly larger wage gains compared with other private sector employees in Minnesota over the last six years, supporting the notion that Minnesota's large corporate headquarters have played a key role in Minnesota's rebound since 2009. The disproportionately high wage income growth at corporate headquarters is consistent with the Wall Street versus Main Street portrayal of the recovery.
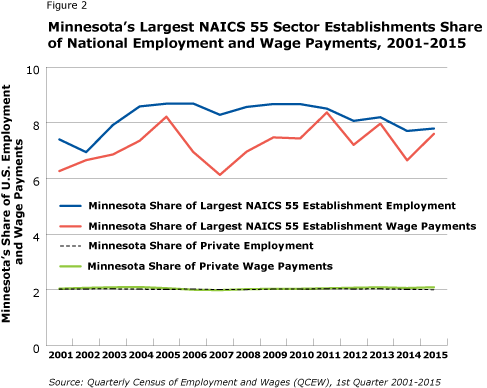
The importance of Minnesota's Fortune 500 headquarters to the state's economy is reinforced by comparing the state's share of U.S. headquarters employment and wage income to the state's share of U.S. private employment and wage income (see Figure 2). Private jobs and private wage payments in Minnesota have accounted for roughly 2 percent of nationwide private jobs and wage payments over the last 15 years. That consistency indicates that private employment and wages in Minnesota have closely tracked the ups and downs in national private employment and wage income since 2001.

But Minnesota's share of U.S. employment and wage income at the largest NAICS 55 establishments is nearly four times the state's 2 percent share of overall U.S. private employment and wages. The 14 corporate establishments with more than 1,000 employees in Minnesota accounted for 7.8 percent of total employment and 7.6 percent of total wage income reported by the 253 U.S. NAICS 55 establishments with 1,000 or more employees last year.
As stated earlier, Minnesota's largest corporate headquarters accounted for 1.6 percent of the state's private employment and 4.6 percent of the state's wage payments during the first quarter of 2015. Nationally, though, large corporate headquarters accounted for 0.4 percent of private employment and 1.5 percent of wage payments. Minnesota's concentration of large corporate headquarters is more than three times higher than nationally when judged by employment and wage income.
Tables 2 and 3 highlight Minnesota's unique concentration of large corporate headquarters in comparison with other states. Table 2 ranks the 20 states that have publishable employment data on headquarters establishments with employment above 1,000. These 20 states combined had 226 of the 253 headquarters establishments with workforces above 1,000.6 Their combined payroll in the first quarter of last year was 400,000 employees earning $17.8 billion. Minnesota's large-size headquarters top the 20 states in both the share of private employment and share of private wage payments. Minnesota yields the top spot to Arkansas when share of private employment and wage income is calculated using all-size management of company establishments and not just the large-size firms (see Table 3).
| Largest NAICS 55 Sector Establishments*
Share of State Private Employment and Wage Payments |
|||
|---|---|---|---|
| Share of Private Employment | Share of Private Wage Payments | ||
| Minnesota | 1.6 | Minnesota | 4.6 |
| Ohio | 1.0 | Ohio | 3.0 |
| Oregon | 0.9 | Oregon | 3.0 |
| Missouri | 0.8 | New Jersey | 2.9 |
| New Jersey | 0.6 | North Carolina | 2.8 |
| Michigan | 0.6 | Michigan | 2.2 |
| North Carolina | 0.6 | Missouri | 2.1 |
| Washington | 0.6 | Pennsylvania | 2.0 |
| Illinois | 0.5 | Washington | 1.3 |
| Pennsylvania | 0.5 | Virginia | 1.3 |
| Virginia | 0.4 | Illinois | 1.3 |
| Georgia | 0.4 | Georgia | 1.3 |
| Massachusetts | 0.4 | Tennessee | 1.2 |
| Tennessee | 0.3 | Massachusetts | 1.1 |
| California | 0.3 | California | 1.0 |
| Kentucky | 0.3 | Texas | 0.9 |
| New York | 0.3 | New York | 0.8 |
| Texas | 0.3 | Kentucky | 0.7 |
| Arizona | 0.3 | Arizona | 0.6 |
| Florida | 0.2 | Florida | 0.5 |
| * NAICS 55 establishments with more than 1,000 employees.
Source: Quarterly Census of Employment and Wages (QCEW), 1st Quarter 2015 data |
|||
| NAICS 551114 - Management of Companies
Share of State Private Employment and Wage Payments |
|||
|---|---|---|---|
| Share of Private Employment | Share of Private Wage Payments | ||
| Arkansas | 3.3 | Arkansas | 8.6 |
| Minnesota | 3.2 | Minnesota | 7.1 |
| Ohio | 3.0 | Ohio | 6.9 |
| Missouri | 2.9 | Rhode Island | 6.8 |
| Rhode Island | 2.8 | Oregon | 6.6 |
| Oregon | 2.7 | Missouri | 6.4 |
| Pennsylvania | 2.6 | Pennsylvania | 6.1 |
| Nebraska | 2.5 | Nebraska | 5.6 |
| Virginia | 2.5 | New Jersey | 5.6 |
| Wisconsin | 2.4 | Nevada | 5.5 |
| North Carolina | 2.3 | Virginia | 5.2 |
| New Jersey | 2.2 | Connecticut | 5.2 |
| Connecticut | 2.1 | North Carolina | 5.2 |
| Massachusetts | 2.1 | Wisconsin | 4.9 |
| Nevada | 2.0 | Illinois | 4.3 |
| Illinois | 2.0 | Massachusetts | 4.0 |
| Maine | 1.8 | Michigan | 3.9 |
| New York | 1.8 | Colorado | 3.9 |
| Georgia | 1.7 | Delaware | 3.8 |
| Colorado | 1.6 | Georgia | 3.6 |
| Source: Quarterly Census of Employment and Wages (QCEW), 2014 data | |||
Minnesotan's swagger about the state's unique concentration of large corporate headquarters is backed up by employment and wage payment numbers. A few words of caution, though, about the reliability of NAICS 55 employment and wage data across states. Under that system, companies are supposed to break out their management-related employment and report it separately each quarter to each state's unemployment insurance program agency. These agencies are supposed to verify each company's reporting.
Minnesota, however, struggles with getting companies to report employment and wage records correctly, as do other states. Still, management of companies employment and wage income data should be as reliable in Minnesota as in any other state.
1Here are a couple of examples: Greater MSP or DEEDL Fortune 500.
2See the list at Fortune 500.3 By law, DEED is prohibited from publishing individual company employment information. But employment data can be published once the data is aggregated into sectors and industries as long as individual company employment can't be traced.
4Employment data is from the Quarterly Census of Employment and Wages program.
6The suppression of employment and wage data for the two larger-than-1,000-employee corporate headquarters in Arkansas is an example of why data is suppressed. Disclosure of employment data might be frowned upon by a large general merchandise company and chicken processing company headquartered in that state.