
by Tim O'Neill
December 2021
Much like the state's population overall, there is no doubt that Minnesota's workforce is getting older. The Department of Employment and Economic Development (DEED) has kept an analyzing eye on this trend for quite some time. Two data sources, DEED's Quarterly Employment Demographics (QED) and the U.S. Census Bureau's Quarterly Workforce Indicators (QWI), have allowed us to track this over several decades. This trend will continue to be seen as the baby boomer generation continues to age, unless there is an increase in immigration or an unlikely increase in birth rate. The following article will reveal how Minnesota's share of older workers has shifted in recent history, as well as how this aging compares with other states and the nation.
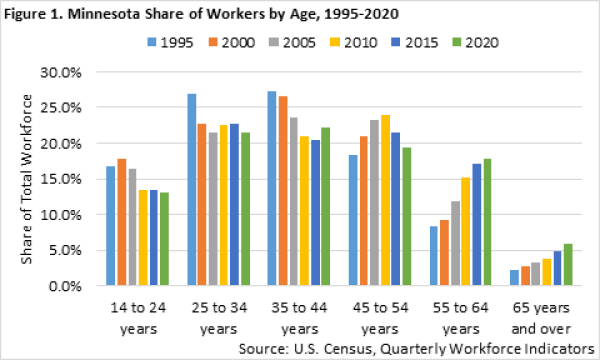 According to QWI data, the share of jobs held by workers aged 55 years and over in Minnesota has increased significantly over the past 25 years. In 1995, for example, about one-in-ten jobs in the state (10.6%) were held by workers 55 years of age and over. By 2005 this share increased to 15.1%, and by 2015 it increased further to 21.9%. In 2020, the share of total jobs held by workers aged 55 years and over was approaching one-in-four (23.8%). Broken down, this increase has been attributable to significant increases in the share of workers both 55 to 64 years of age and 65 years of age and over. Meanwhile, the share of jobs held by workers in Minnesota aged 14 to 24 years, 25 to 34 years, and 35 to 44 years have all decreased over the past 25 years. Interestingly, as the baby boomer generation (people born between 1946 and 1964) moved through demographic age categories, the share of jobs held by workers aged 45 to 54 years increased between 1995 and 2010 before decreasing through 2020 (Figure 1).
Minnesota's shifting workforce shines a spotlight on aging trends that nearly all employers will increasingly face. This is especially so as the state experiences ever-tightening labor market conditions during its recovery after the COVID-19 recession. For example, employers in Minnesota reported more than 205,000 vacancies during the second quarter of 2021. At that time there were approximately 123,600 unemployed persons, resulting in 0.6 unemployed persons for each job vacancy. There simply are not enough workers in the state to fill current job openings. People retiring earlier than what would have been expected during the pandemic has likely exacerbated the current labor shortage.1 But it is important to keep in mind that Minnesota's aging workforce was contributing to a tight labor market pre-pandemic and it will continue to impact Minnesota's labor force after the pandemic finally ends. This will result in employers continuing to utilize new and creative strategies to meet workforce demand, while opening new opportunities for younger workers in the state.
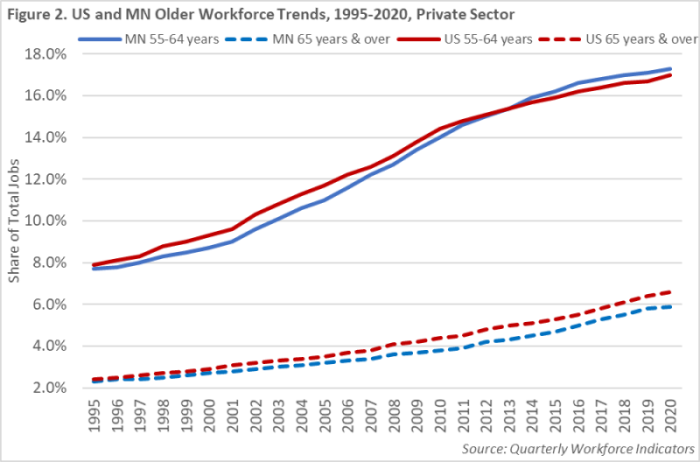
Aging workforce trends are not unique to Minnesota. At the national level, the share of jobs held by workers 55 years of age and older has steadily risen for more than a quarter of a century. Analyzing national private sector employment, the share of jobs held by workers 55 years and older was 10.4% in 1995. This increased to 15.2% in 2005, 18.7% in 2010, 21.2% in 2015, and 23.6% in 2020. Zooming in, the share of jobs held by workers 65 years and older increased from 2.4% in 1995 to 3.5% in 2005, 4.4% in 2010, 5.3% in 2015, and 6.6% in 2020. While maintaining very similar workforce aging trends, Minnesota has had slightly smaller shares of older workers than the United States. As of 2020, the share of Minnesota's private-sector employment held by workers 55 years and over (23.2%) was 0.4 percentage points below the national share (23.6%). The share of Minnesota's private-sector employment held by workers 65 years and over (5.9%) was 0.7 percentage points below the national share (6.6%) (Figure 2).
In both the United States and Minnesota, workers between the ages of 25 and 54 years make up the largest share of total jobs. In Minnesota, the share of jobs held by these workers fell from 71.6% in 1995 to 67.5% in 2010 to 62.8% in 2020. Nationally, the share of jobs held by these workers fell from 72.1% in 1995 to 67.7% in 2010 to 63.6% in 2020. So, as of 2020, the share of Minnesota's total employment held by workers 25 to 54 years is 0.8 percentage points below the respective national share.
Where Minnesota has a slightly smaller share of jobs held by workers 25 to 54 years of age than the nation, it has a slightly higher share of jobs held by workers under the age of 24 years. As of 2020, Minnesota's share of jobs held by workers under 24 years (14.0%) was 1.1 percentage points above the respective national share (12.9%). However, both Minnesota and the United States witnessed a decline in the share of jobs held by younger workers between 2000 and 2010, accelerated by a drop in teen participation during the Great Recession. In Minnesota this share dropped from 19.3% to 14.6%. Nationally, this share dropped from 17.1% to 13.6%. Thanks to a decade-long economic recovery, the share of jobs held by younger workers has held largely steady over the past decade in both Minnesota and the nation.
Using data from Quarterly Workforce Indicators, we can also look at how Minnesota's workforce trends compare with other states. Table 1 highlights the share of jobs held by older workers for states either geographically close to Minnesota or with a similar number of total jobs to Minnesota. Analyzing these states, the share of jobs held by older workers in Minnesota is below the average in both 2005 and 2020. For example, the share of jobs held by workers 55 years and older in Minnesota increased from 15.0% in 2005 to 23.8% in 2020. The average share of jobs held by workers 55 years and older in these select states increased from 16.1% in 2005 to 24.0% in 2020.
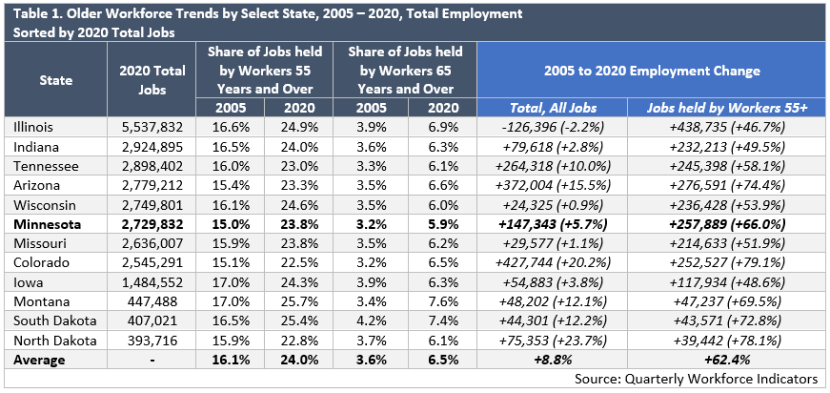
Of these select states, those with the largest share of jobs held by workers 55 years and older in 2020 include Montana, South Dakota, Illinois, and Wisconsin. Those states with the smallest share of jobs held by workers 55 years and older include Colorado, North Dakota, Tennessee, and Arizona. Interestingly, while Arizona and Colorado have lower shares of jobs held by workers 55 years and older, they have higher shares when looking at jobs held by those 65 years and older. Of these select states, Minnesota had the smallest share of jobs held by workers 65 years and older in 2020.
According to QWI data, Minnesota's total employment increased by 147,343 jobs (5.7%) between 2005 and 2020. Note that this does include significant employment decline between 2019 and 2020, due to the COVID-19 recession. Between 2005 and 2020, the number of jobs held by workers 55 years and older in the state increased by 66.0% (257,889 jobs). This percentage increase in the number of jobs held by older workers is slightly above the average increase for those select states highlighted in Table 1 (+62.4%). So, while Minnesota does have slightly smaller shares of older workers, it has witnessed slightly faster aging trends over the past 15 years. Those select states with faster aging trends include Colorado, North Dakota, Arizona, South Dakota, and Montana. Those select states with slower aging trends include Illinois, Iowa, Indiana, Missouri, and Wisconsin (Table 1).
Table 2 presents 2020 employment data, as well as workforce aging trends between 2005 and 2020, for all available states in the U.S., noting that employment data is not available for Alaska, Arkansas, and Mississippi. Minnesota ranked 14th in the nation for the largest proportional increase in the number of jobs held by workers 55 years and older between 2005 and 2020. The state's 66.0% increase in the jobs held by these workers was 5.8 percentage points above the average for all available states (60.2%). Those states with the largest proportional increases in older workers during that period include Utah, Texas, Colorado, Idaho, North Dakota, Washington, and Arizona. Those states with the smallest proportional increases in older workers during that period include Massachusetts, West Virginia, Connecticut, and Nevada (Table 2).
| State | 2020 Employment Data | 2005 – 2020 Employment Change | |||
|---|---|---|---|---|---|
| Total Jobs | Jobs Held by Workers 55+ | Jobs Held by Workers 65+ | Total, All Jobs | Jobs Held by Workers 55+ | |
| California | 16,354,669 | 24.0% | 7.2% | +9.9% | +68.9% |
| Texas | 11,967,948 | 22.3% | 6.3% | +28.3% | +94.6% |
| New York | 8,729,797 | 24.8% | 6.7% | +4.7% | +53.3% |
| Florida | 8,461,009 | 25.6% | 7.2% | +11.6% | +64.3% |
| Illinois | 5,537,832 | 24.9% | 6.9% | -2.2% | +46.7% |
| Pennsylvania | 5,480,178 | 26.1% | 7.0% | +1.2% | +51.3% |
| Ohio | 5,089,615 | 24.4% | 6.2% | -2.4% | +45.4% |
| North Carolina | 4,295,501 | 23.8% | 6.4% | +13.8% | +67.3% |
| Georgia | 4,231,672 | 22.3% | 5.7% | +11.7% | +71.4% |
| Michigan | 3,990,151 | 23.9% | 5.7% | -6.3% | +47.6% |
| New Jersey | 3,750,513 | 27.3% | 7.6% | -2.5% | +46.9% |
| Virginia | 3,587,834 | 24.6% | 6.7% | +5.8% | +62.9% |
| Massachusetts | 3,350,374 | 25.6% | 7.0% | N/A | N/A |
| Washington | 3,211,901 | 23.0% | 6.4% | +19.8% | +75.8% |
| Indiana | 2,924,895 | 24.0% | 6.3% | +2.8% | +49.5% |
| Tennessee | 2,898,402 | 23.0% | 6.1% | +10.0% | +58.1% |
| Arizona | 2,779,212 | 23.3% | 6.6% | +15.5% | +74.4% |
| Wisconsin | 2,749,801 | 24.6% | 6.0% | +0.9% | +53.9% |
| Minnesota | 2,729,832 | 23.8% | 5.9% | +5.7% | +66.0% |
| Missouri | 2,636,007 | 23.8% | 6.2% | +1.1% | +51.9% |
| Colorado | 2,545,291 | 22.5% | 6.5% | +20.2% | +79.1% |
| Maryland | 2,386,343 | 25.6% | 7.3% | +0.4% | +54.6% |
| South Carolina | 2,022,690 | 24.0% | 6.6% | +13.3% | +63.8% |
| Alabama | 1,862,899 | 22.9% | 6.0% | +2.1% | +49.7% |
| Oregon | 1,839,042 | 23.8% | 7.1% | +13.8% | +60.5% |
| Kentucky | 1,794,664 | 22.2% | 5.6% | +5.2% | +60.1% |
| Louisiana | 1,753,778 | 23.7% | 6.7% | -0.8% | +55.2% |
| Connecticut | 1,534,435 | 27.6% | 7.5% | -5.6% | +42.7% |
| Oklahoma | 1,517,747 | 23.5% | 6.8% | +8.3% | +55.7% |
| Iowa | 1,484,552 | 24.3% | 6.3% | +3.8% | +48.6% |
| Utah | 1,477,690 | 18.8% | 5.5% | +36.8% | +100.8% |
| Kansas | 1,327,772 | 25.2% | 7.3% | +4.1% | +57.4% |
| Nevada | 1,285,288 | 23.2% | 6.8% | +7.9% | +44.5% |
| Nebraska | 937,777 | 24.4% | 6.8% | +7.5% | +58.1% |
| New Mexico | 763,723 | 24.7% | 7.2% | +3.4% | +59.1% |
| Idaho | 739,711 | 22.1% | 6.2% | +24.0% | +78.2% |
| West Virginia | 630,658 | 24.7% | 6.7% | -6.8% | +41.7% |
| New Hampshire | 626,495 | 28.0% | 7.5% | +1.8% | +67.7% |
| Maine | 576,300 | 27.9% | 7.6% | -1.1% | +55.3% |
| Hawaii | 480,267 | 26.9% | 8.5% | -4.5% | +52.9% |
| Montana | 447,488 | 25.7% | 7.6% | +12.1% | +69.5% |
| Rhode Island | 440,000 | 27.1% | 7.3% | -6.3% | +47.9% |
| Delaware | 426,861 | 25.0% | 6.8% | +3.1% | +57.7% |
| South Dakota | 407,021 | 25.4% | 7.4% | +12.2% | +72.8% |
| North Dakota | 393,716 | 22.8% | 6.1% | +23.7% | +78.1% |
| Vermont | 278,915 | 28.4% | 8.2% | -6.8% | +50.8% |
| Wyoming | 255,914 | 24.7% | 7.1% | +3.0% | +56.3% |
| Source: Quarterly Workforce Indicators
Note, state data is absent for Alaska, Arkansas, and Mississippi |
|||||
It should be noted that with the COVID-19 recession, all states with available data witnessed either no growth or decreases in the shares of jobs held by older workers between 2019 and 2020. After decades of aging workforce trends, the share of Minnesota's jobs held by workers 55 years and older dropped by 4.9% between 2019 and 2020. This decline may be temporary or it could be more long lasting, depending upon whether these older workers decided to permanently retire early or are waiting out the pandemic and plan to return to the labor force.
While data from the U.S. Census Bureau's QWI and DEED's QED tool rely on differing methodologies, they both reveal Minnesota's aging workforce. According to DEED's QED data, the share of workers in the state aged 55 and over increased from 13.7% in 2005 to 19.7% in 2015 to 22.4% in 2020. Those workers aged 65 and over increased from 2.8% in 2005 to 4.0% in 2015 to 5.1% in 2020, according to QED data.
With DEED's QED data, we can also break down aging trends by industry. This provides for a unique look at those industries in Minnesota that have older workforces. In 2020, Transportation & Warehousing had the state's oldest workforce with 30.8% of its workers being 55 years of age and older. Other major industry sectors having at least one-fourth of their respective workforces being 55 years of age and older were Real Estate & Rental & Leasing (28.0%), Utilities (27.0%), Public Administration (26.7%), Wholesale Trade (26.6%), Manufacturing (26.1%), and Educational Services (25.7%). Except for Accommodation & Food Services, Construction, and Administrative & Support Services, the other remaining major industries all had between one-fifth and one-fourth of their respective workforces aged 55 years and over (Figure 3).
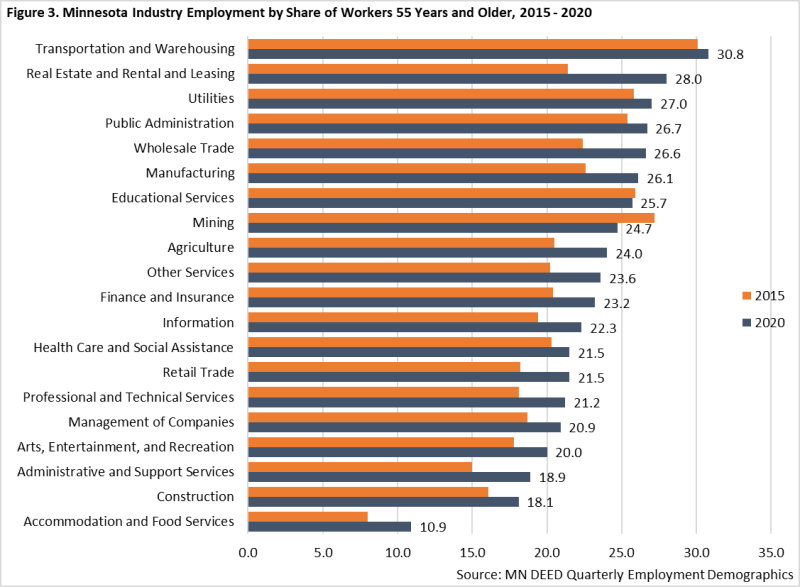
Figure 3 further highlights how the share of workers aged 55 years and over has changed by major industry sector between 2015 and 2020. Except for Mining and Educational Services, every industry sector in Minnesota had a higher share of workers aged 55 years and over in 2020 than they did in 2015. The change in share of such workers increased especially so for Real Estate & Rental & Leasing (+6.6 percentage points), Wholesale Trade (+4.2), Administrative & Support Services (+3.9), Agriculture (+3.5), Manufacturing (+3.5), Other Services (+3.4), Retail Trade (+3.3), and Professional & Technical Services (+3.1). Again, the share of workers aged 55 and over increased by 2.7 percentage points during that period, from 19.7% in 2015 to 22.4% in 2020.
Zooming out with DEED's QED data, Figure 3 highlights the average yearly change in the share of workers aged 65 years and over by major industry sector. Between 2005 and 2019, most industries witnessed their respective workforces aged 65 years and over increase by a yearly average of 0.1 to 0.2 percentage points. Those industries averaging faster average annual growth for this older age cohort included Transportation & Warehousing, Real Estate & Rental & Leasing, and Retail Trade.
More recently, between 2014 and 2019, the average annual growth in the share of workers aged 65 years and over accelerated for 13 of 20 major industry sectors. During that period, industries where their respective workforces aged 65 years and over increased by an annual average of 0.4 percentage points included Retail Trade, Agriculture, Real Estate & Rental & Leasing, and Transportation & Warehousing (Figure 4).
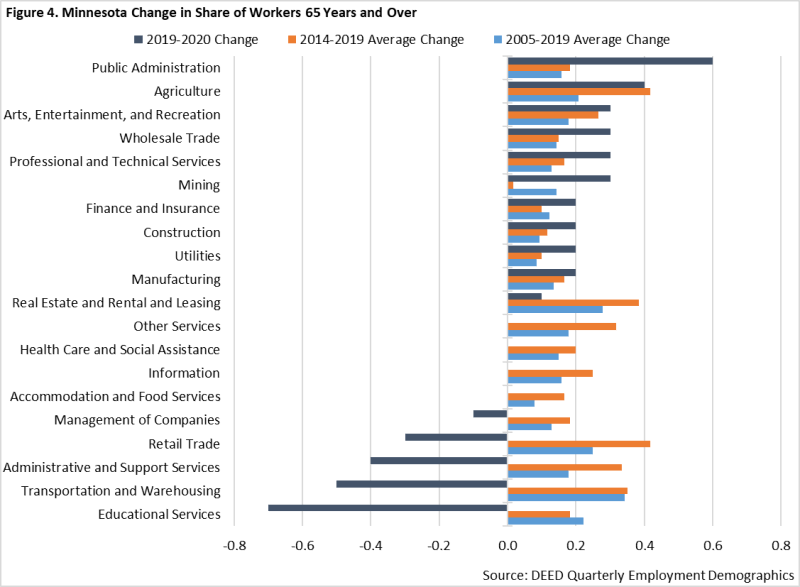
Between 2019 and 2020, the change in the share of workers aged 65 years and over by industry proved to be much more erratic and unpredictable. Again, this is likely due to COVID-19's major impact upon Minnesota's labor markets. At one end of the extreme were Educational Services, Transportation & Warehousing, Administrative & Support Services, Retail Trade, and Management of Companies. Where each of these sectors had been witnessing historical growth in their respective workforces aged 65 years and over, 2020 brought sudden decreases. For example, where the share of workers aged 65 years and over in Transportation & Warehousing increased by an annual average of 0.4 percentage points between 2015 and 2019, it decreased by 0.5 percentage points between 2019 and 2020 (Figure 3). Average annual growth in the share of such workers slowed to zero over the past year of available data as well for Accommodation & Food Services, Health Care & Social Assistance, Information, and Other Services, while also slowing over-the-year for Real Estate & Rental & Leasing.
Interestingly, the share of workers aged 65 years and over increased the most between 2019 and 2020 for Public Administration and Mining, while also increasing slightly in Professional & Technical Services, Wholesale Trade, Construction, Finance & Insurance, and Utilities.
Understanding Minnesota's aging workforce is vital as the state's labor market continues to recover from the impacts of COVID-19. It is also vital to understand such trends as workforce shortages intensify and Minnesota employers struggle to adapt to tight labor market conditions.
1Senf, Dave. "Accelerated Retirements May be Playing a Role in the Current Workforce Shortage." Minnesota Economic Trends, Sept. 2021.