by Amanda Rohrer
May 2015
The unemployment rate calculation in this country is a national achievement - we have a consistent, comparable time series of unemployment data for the entire country going back to 1948. No other nation in the world has tracked employment information that long - even Eurostat, the European Union's statistical agency, only publishes data back to 1990, although individual countries may have a comparable series going further back. Although it may sound trivial, this allows us to analyze trends through many generations. For example, having data on labor force participation for women as they were pushed out of the workforce following World War II and then again as they made gains in the 80s and 90s gives us a much clearer picture of social behavior than is available in many places in the world. The trouble with having such a long history is that to continue it you have to keep producing data the same way. Even as technology changes and the questions of interest to researchers and the public evolve, the core of the survey and methods must remain the same and changes have to be carefully considered and tested. The data series for Minnesota is not as long or storied, but because it's a part of the same program, we have to ensure it's consistent in methods and reliability.
Every year the unemployment rates are replaced with new numbers for all areas smaller than the U.S. The Current Population Survey (CPS) is the source of unemployment rate data for the U.S . - it's designed to be statistically reliable and available quickly enough to support a data release less than a month after the reference week. According to the Census Bureau, "The CPS has one of the highest response rates among government household surveys, averaging around 90 percent. This rate is calculated after excluding those housing units that are either unoccupied (vacant, under construction) or occupied solely by persons not eligible for interview." Unfortunately, the procedures that keep that response rate so high also make the survey very expensive. While the sample is stratified to ensure coverage in all states, in most states the Bureau of Labor Statistics (BLS) has opted to use a statistical model to improve reliability in lieu of expanding sample size. The core of this model is still the CPS, but significant economic events that are more apparent in the Current Employment Statistics (CES) survey of employers or in Unemployment Insurance claims counts derived from administrative data are given some weight - how much varies from state to state based on its own sample size. Additionally, state employment and unemployment are ratio-adjusted to sum to regional and national totals - this ensures consistency throughout the nation and with the core national series.
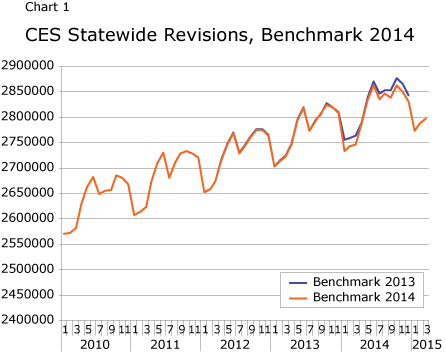
The statistical models depend on the historical series and the other data programs - CES and Unemployment Insurance. While both of those programs make data available to the LAUS program in time to make the monthly deadline, they also revise data as time goes on to get a more accurate series. Claims are contested or filed late, so counts for the reference period can change depending on when you extract them. The CES is a survey of employers - some reporters file their forms, but do it late. The response rate improves the longer you wait, so there's a monthly revision to pull in more of that data. It's also benchmarked against the Quarterly Census of Employment and Wages (QCEW), a program that collects employment counts from all employers who pay into the Unemployment Insurance program, which in Minnesota is about 97 percent of firms. Those data are released only much later - they lag by six to nine months. Incorporating those numbers helps keep the historical series accurate, but it also has a ripple effect on the current numbers, resulting in changes on an annual basis. In Chart 1 the revisions to the CES data as part of the 2014 Benchmark period are shown. Changes start small but in some months get to be quite large, up to 20,000 jobs.

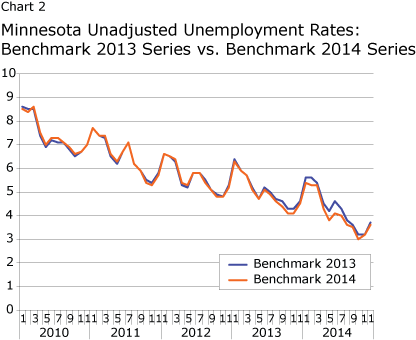
Once there are changes to the inputs for the unemployment rate model, the model has to be run again to incorporate them. Because the historical series is part of the input, all of the data have to be recalculated, not just the years with changes. The largest changes occur in the recent past, but occasionally small changes filter back further (see Chart 2).

Substate estimates for counties, Metropolitan Statistical Areas (MSAs), and cities have yet different methods. The CPS sample isn't big enough to estimate small areas, so employment and unemployment numbers for each small area are calculated using the best available inputs adjusted to match the concept of the CPS. Employment inputs are from CES for areas covered by the CES program (metropolitan statistical areas) and from projected QCEW employment for other areas. In both cases commuting patterns data from the American Community Survey (ACS) are used to distribute the employer-based source data to match the worker-based unemployment rate concept. Estimates of non-covered employment are also added, since the CPS has a broader definition of employment than either of the employer-based sources. Unemployment starts with unemployment insurance claims, but is adjusted using ACS demographic data to include new-entrants (young people) and re-entrants (people who have been out of the labor force for a while). It also uses a diminishing ratio on unemployment insurance final payments to account for the long-term unemployed. Once employed and unemployed numbers are calculated for each area and across state lines, they're scaled to the state totals from the CPS. During annual processing, unemployment numbers are replaced with a fresh extract from the unemployment insurance program, and employment inputs are replaced with the revised CES series and with actual, not projected, QCEW values.
During the 2014 benchmark period that has just been completed, these changes were a little more significant than usual. The 2010 Census didn't include a long form since the Census Bureau has been working on replacing that survey with the ACS. Unfortunately, the ACS doesn't ask all the same questions that the Census long form did and sometimes doesn't ask questions in the same way. Since the LAUS program is producing estimates for very small areas and is looking for data on particular subsets of workers like the self-employed or agricultural workers, only five-year ACS estimates contain the necessary detail. Since estimates are for such a long span of time, it's unclear what effect this has on the overall presentation of trends and seasonality. Adapting to these conceptual changes has necessitated a redesign of a lot of the adjustment processes that are done to make employment and unemployment inputs match CPS concepts. To prevent an abrupt change in the substate series, this was done going back to 2010 with all the previous data replaced.
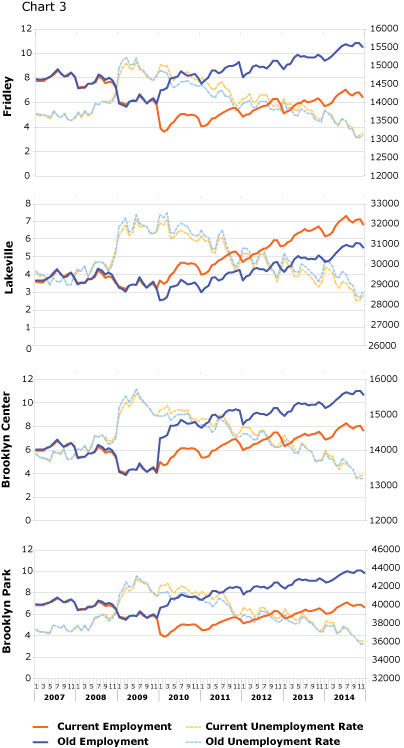
Some examples of noticeable changes to substate data are included in the charts below. To keep the data for component areas consistent with the larger areas in which they reside, estimates are first produced for the largest areas: Metropolitan Statistical Areas where available and counties or combinations of counties called Labor Market Areas (LMAs) elsewhere. For smaller counties and cities within these areas, disaggregation ratios derived from Census data and unemployment insurance claims are used to distribute employment and unemployment from the MSA or LMA. With the transition to ACS data, Fridley, Lakeville, Brooklyn Center, and Brooklyn Park all had larger than average changes to their disaggregation ratios for employment. The solid blue lines (see Chart 3) are the employment numbers for the areas from the previous benchmark period and the orange lines are what results with the most recent revision. In the background the dotted lines show the unemployment rate. All of these cities fall within the Minneapolis-St. Paul MSA, meaning their employment numbers are affected by CES revisions, particularly in the most recent couple of years. Despite the apparent level-shifts in employment, however, the final rates have modest changes and continue to tell the same story of the economy.

| City | Current Ratio | Former Ratio | Percentage Difference |
|---|---|---|---|
| Brooklyn Center city, MN | 0.0225111 | 0.024232200 | 7.1% |
| Brooklyn Park city, MN | 0.0614439 | 0.067144300 | 8.5% |
| Fridley city, MN | 0.0777799 | 0.084078500 | 7.5% |
| Lakeville city, MN | 0.1433274 | 0.135124900 | -6.1% |
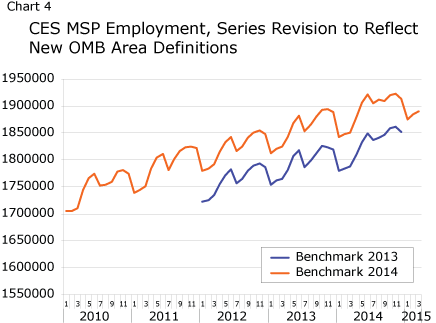
Additionally, in 2013 the U.S. Office of Management and Budget (OMB) changed the official statistical areas. In Minnesota they added three counties to the Minneapolis-St. Paul-Bloomington MSA and one county to the Rochester MSA. They also dropped Fairmont as a micropolitan. Since CES is based on MSAs, LAUS methods had to be adjusted to match their area definitions as well (see Chart 4).

While all the changes that were made were individually quite minor, the total effect this year was a fairly major change to the methodology. Some small areas have seen noticeable shifts in their unemployment rates.
Unemployment rate calculation is a complex process, limited by history, budget, and far-reaching policy decisions. Given the constraints and available data, the BLS in partnership with the states puts out the best quality and most detailed unemployment rate data possible, even though the additive model used for small areas has limitations. Knowing this helps inform users of the data in their interpretation of its meaning. Although methods are consistent across areas and through different states, there are unavoidable transitions in the time series for small areas as a result of our incorporation of other data sources. Care should be exercised in comparing long spans of local unemployment rates, although the national and statewide series are carefully maintained to avoid methodological inconsistencies.