by Sanjukta Chaudhuri
September 2018
Minority women earn less than white women and men in Minnesota, even when they have the same level of education.
This article examines the economic status of racial and ethnic minority women in Minnesota, focusing on educational attainment and labor market outcomes. The minority communities examined are African American (black), Asian, American Indian or Alaska Native (AIAN), and women of Hispanic origin. This analysis compares the economic status of minority women with white women and men.
The data were drawn from the 2012-2016 one-year American Community Survey (ACS) microdata unless otherwise indicated.1 Full-time workers ages 25 to 64 were used for the analysis, with full time defined as at least 40 hours per week.
The race/ethnicity categories analyzed in this article are highly aggregated categories and are by no means representative of the wide diversity of people who identify with sub-categories based on their ethnic origins. For example, the category "Asian" can include persons with a wide range of origins, including but not limited to Cambodian, Chinese, Indian, Japanese, Korean, Hmong and Filipino. Combining all these ethnicities as "Asian" naturally hides the wide diversity of immigration, education and economic experiences that are often associated with a person's specific ethnic origin. Unfortunately, the ACS has limited data availability on race/ethnicity and hence the data source itself limits our ability to delve deeper into each of these summary race categories. Also, given the small minority population of Minnesota, fragmenting race groups into sub-categories leads to large margins of error and renders results unreliable. With these considerations, we focus only on the aggregated race categories with the acknowledgment that this way of analyzing the data falls short of representing the true nature of experiences of Minnesota's diverse population.
Minnesota is not one of the nation's more diverse states. The white population is 84.4 percent of the state's total population compared with 73 percent nationwide. Blacks account for 5.6 percent of Minnesota's population compared with 12.7 percent nationwide. Asians are 4.6 percent of the state population compared with 5.3 percent nationwide, and AIAN are 1.1 percent of the population compared with 0.8 percent nationwide. Another 4.3 percent of Minnesota's population is minority racial/ethnic groups compared with 7.8 percent nationwide. Hispanics are 5 percent of the state's population compared with 17.3 percent nationwide.
In Minnesota the average female is 39.1 years old, with white females at 40.5 years and minority females typically younger. Hispanic females are on average the youngest at 26.2 years old. Sixty-four percent of Minnesota women are in the working-age population (ages 16 to 64). Asians have the highest proportion of working-age women (66 percent) followed by whites at 63.6 percent. For other minority groups, the share is around 60 percent.
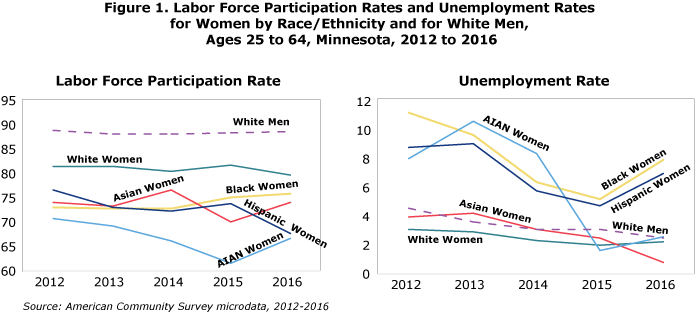
Overall, women have lower rates of labor force participation than white men. White women have the highest rates of participation among women, while AIAN women have the lowest. As for unemployment rates, white and Asian women have the lowest unemployment rates, while black and Hispanic women have the highest (see Figure 1).

Women in Minnesota earn less than men at the median. Limiting the analysis to full-time employed workers ages 25 to 64, women earn $43,000 annually, while men earn $50,000 – a gender earnings gap of 14 percent.
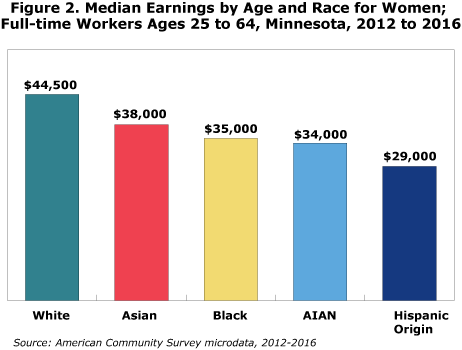
Median earnings vary widely by gender and race. Figure 2 shows that among women, white women have the highest annual median earnings at $44,500, followed by Asians at $38,000, blacks at $35,000, AIAN at $34,000 and Hispanic women at $29,000.

Men of all ethnicities earn more than their female counterparts, with white men at the top at $52,000 and Hispanic men at the bottom at $32,700.
With the highest-earning demographic – white men – as the benchmark, the earnings gap by gender and ethnicity is as follows: 14.4 percent for white women, 26.9 percent for Asian women, 32.7 percent for black women, 34.6 percent for American Indian women and 44.2 percent for Hispanic women.
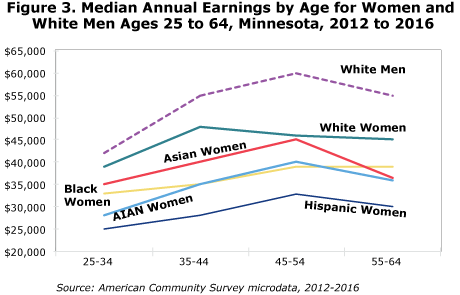
Figure 3 shows that earnings gaps by gender and ethnicity are consistent across age. Over time, women never catch up with the earnings of their male counterparts, and minority women generally do not catch up with their higher earning counterparts of other ethnicities. Black women are one exception to this trend, possibly because they are likely to continue working well into typical retirement years.

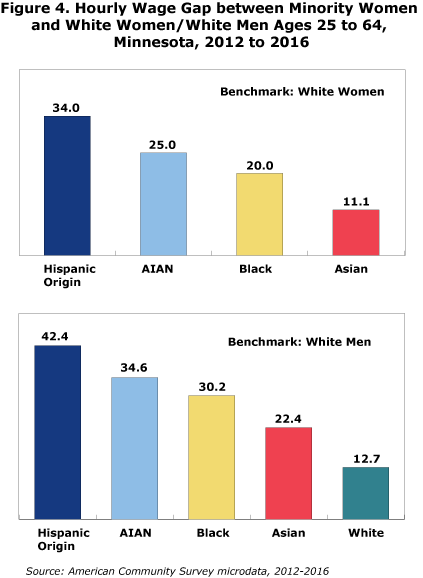
An even clearer picture of earning gaps among women by ethnicity emerges when we convert annual earnings into hourly wage rates by adjusting for hours of work. Figure 4 shows that minority women earn less on an hourly basis than white women and men. Asian women earn 11.1 percent less per hour than white women, while black women earn 20 percent less, AIAN earn 25 percent less and Hispanic women earn 34 percent less.

A similar story emerges when compared with white men, although the hourly wage gap is much higher. White women earn 12.7 percent less than white men, while Asian women earn 22.4 percent less, black women earn 30.2 percent less, AIAN women earn 34.6 percent less and Hispanic women earn 42.4 percent less.
Minnesota women in their prime working years (ages 25 to 64) are relatively more educated than their counterparts in other states: 39.3 percent have bachelor's or advanced degrees. By ethnicity, however, there is wide variation in educational attainment. Almost one quarter of Hispanic, 19 percent of black, 18 percent of white, 16 percent of AIAN and 13 percent of Asian women have only a high school diploma.
Asian and white women are more likely to have a postsecondary credential, with 31.1 percent of Asian and 27.6 percent of white women holding a bachelor's degree. This percentage drops drastically to 15.6 percent for Hispanic women, 13.5 percent for AIAN women and 11.5 percent for black women. Asian women are most likely to have an advanced degree (21 percent), while AIAN women are least likely (5.3 percent).
Table 1 shows that wage gaps by gender and race remain consistent even when broken out by educational attainment. Minority women with bachelor's degrees earn between 12 and 22 percent less than white women, with bachelor's degrees. The earnings gaps by race and ethnicity at similar levels of educational attainment are even starker when using white men as the benchmark. Women earn between 23.9 percent and 40.3 percent less than white men with the same educational attainment. Similar earnings gaps by gender and ethnicity are seen at other levels of educational attainment.
| Table 1. Median Annual Income by Education and Race for Women in Minnesota | ||||
|---|---|---|---|---|
| Race/Ethnicity | Highest Degree Earned | |||
| HS | AA | BA | Advanced Degree | |
| White Women | $32,700 | $40,000 | $51,000 | $67,000 |
| Black Women | $26,000 | $38,000 | $45,000 | $67,000 |
| Asian Women | $28,000 | $36,000 | $44,400 | $66,000 |
| AIAN Women | $28,000 | $33,000 | $40,000 | $67,000 |
| Hispanic Women | $22,000 | $28,000 | $40,000 | $60,000 |
| White Men | $40,000 | $52,000 | $67,000 | $85,000 |
| Source: American Community Survey microdata, 2012-2016 | ||||
Occupational choice makes a big difference in earnings. An examination of occupations most frequently chosen by women of various ethnicity sheds some light on the earnings gaps discussed here. Overall, Hispanic women take up low-paying occupations, while white and Asian women track into medium- or high-paying occupations. Black and AIAN women tend to be in a mix of medium- and lower-paying occupations.
Table 2 shows that white women are found in medium- to higher-paying jobs such as registered nurses and accountants (both medium-income occupations), as well as high-paying management occupations. Asian women are found in a wider range of occupations, including software developers (high income), accountants (medium income) and personal appearance workers and production assemblers, both low-income occupations.
| Table 2. Top Five Occupations for Women by Race/Ethnicity, Full-Time Workers Ages 25 to 64, Minnesota | ||||
|---|---|---|---|---|
| White | Black | Asian | AIAN | Hispanic |
| Elementary and Middle School Teachers ($52,000; medium) | Nursing, Psychiatric and Home Health Aides ($30,000; low) | Miscellaneous Assemblers and Fabricators ($30,000; low) | Elementary and Middle School Teachers ($52,000; medium) | Maids and Housekeeping Cleaners ($21,000; very low) |
| Secretaries and Administrative Assistants ($54,000; medium) | Personal Care Aides ($22,900; very low) | Software Developers, Applications and Systems Software ($86,000; high) | Social Workers ($48,000; medium) | Janitors and Building Cleaners ($32,000; low) |
| Registered Nurses ($65,000; high-medium) | Customer Service Representatives ($39,000; low) | Miscellaneous Personal Appearance Workers ($22,000; very low) | Nursing, Psychiatric, and Home Health Aides ($30,000; low) | Packers and Packagers, Hand ($24,000; very low) |
| Miscellaneous Managers, Including Funeral Service Managers and Postmasters and Mail Superintendents ($72,000; high) | Social Workers ($48,000; medium) | Miscellaneous Managers, Including Funeral Service Managers and Postmasters and Mail Superintendents ($72,000; high) | Accountants and Auditors ($58,000; medium) | Customer Service Representatives ($39,000; low) |
| Accountants and Auditors
($58,000; medium) |
Registered Nurses ($65,000; high-medium) | Accountants and Auditors ($58,000; medium) | Secretaries and Administrative Assistants ($54,000; medium) | Cooks ($24,000; very low) |
| % Full Time in Top 5 Occupations | ||||
| 19.4% | 27.4% | 21.4% | 18.8% | 20.2% |
| Source: American Community survey microdata, 2012-2018 | ||||
Black women are also found in a range of occupations, including customer service, health aide and personal care aide occupations (all low-income occupations), as well as registered nurses and social workers (both medium-income occupations). AIAN women tend to be social workers, teachers, accountants and secretaries (all medium-income occupations). Lastly, Hispanic women are found in low- or very low-paying occupations, including maids, janitors, packers and cooks.
Minority women in Minnesota have lower educational attainment, higher unemployment rates, lower earnings, lower wage rates and track into lower-paying occupations. The earnings gaps remain fairly stable over different age groups.
Earnings gaps do not disappear when women of different races have the same educational attainment. This is especially true of black, Hispanic and AIAN women. Asian women have lower unemployment rates and higher educational attainment, but they still have earnings and wage rates below white women and men. Look for future Trends articles on this topic, with particular focus on education, fields of study and occupational choices.
1The online analysis tool in the ACS website, as well as the microdata were used for analysis.