By Mark Schultz
June 2020
The Postal Service subsector falls under the Trade, Transportation, and Utilities supersector and includes "activities of the National Post Office and its subcontractors in delivering letters and small parcels, normally without pick-up at the sender's location" according to the Bureau of Labor Statistics. This subsector makes up 2.3 percent of the total employment in Trade, Transportation, and Utilities at 803 employing establishments (see Table 1).
Table 1. Minnesota Postal Service Industry Employment Statistics (2019)| Industry Title | Average Employment | Average Establishments | Total Payroll | Average Annual Wage |
|---|---|---|---|---|
| Total, All Industries | 2,900,881 | 178,094 | $172,989,740,202 | $59,644 |
| Trade, Transportation, and Utilities | 546,215 | 38,249 | $27,834,059,040 | $50,908 |
| Transportation and Warehousing | 110,858 | 5,794 | $6,161,282,140 | $55,536 |
| Postal Service | 12,363 | 803 | $747,959,985 | $60,476 |
| Source: DEED Quarterly Census of Employment and Wages | ||||
Also shown in Table 1, Postal Service makes up 2.7 percent of the total payroll in the Trade, Transportation, and Utilities industry in the state. Average annual wages in the Postal Service industry rest at $60,476, which is 1.4 percent higher than the wages seen across all industries and 18.8 percent higher than the average annual wage seen in the Trade, Transportation, and Utilities supersector. Since 2010 (2009 data was not available), the average annual wage in Postal Service increased by almost $6,000, a jump of 11 percent.
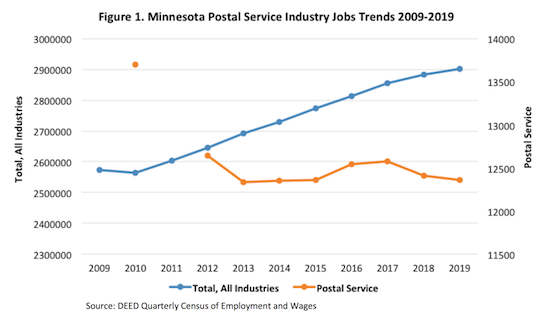
While the number of jobs across all industries enjoyed a rather steady increase over the last 10 years, the number of jobs in Postal Service experienced a large decline at the beginning of the decade before maintaining a more stable pattern. Since 2010 the number of Postal Service jobs decreased by 1,336 jobs, equaling a drop of 9.8 percent (see Figure 1).

Primary Metal Manufacturing is part of the broader Manufacturing sector and makes up 1.9 percent of the total manufacturing jobs in the state, with 6,045 jobs in 89 employing establishments. This sector of manufacturing is made up of three smaller industries, including Steel Product Manufacturing from Purchased Steel (891 jobs in 27 establishments), Alumina and Aluminum Production and Processing (748 jobs in eight establishments), and the bulk of the jobs appearing in Foundries (3,604 jobs in 47 establishments) (see Table 1).
Table 1. Minnesota Primary Metal Manufacturing Industry Employment Statistics (2019)| Industry Title | Average Employment | Average Establishments | Total Payroll | Average Annual Wage |
|---|---|---|---|---|
| Total, All Industries | 2,900,881 | 178,094 | $172,989,740,202 | $59,644 |
| Manufacturing | 323,954 | 8,261 | $22,054,885,371 | $68,068 |
| Primary Metal Manufacturing | 6,045 | 89 | $389,524,166 | $64,480 |
| Steel Product Manufacturing from Purchased Steel | 891 | 27 | $50,206,198 | $56,316 |
| Alumina and Aluminum Production and Processing | 748 | 8 | $44,534,093 | $59,696 |
| Foundries | 3,604 | 47 | $225,538,315 | $62,608 |
| Source: DEED Quarterly Census of Employment and Wages | ||||
Median annual wages in Primary Metal Manufacturing sit at $64,480, which is almost $3,600 (-5.3 percent) less than in the broader Manufacturing industry, but is $4,836 (+8.1 percent) higher than the wages across all industries. The highest paying sub-sector is Foundries with a median annual wage of $62,608, followed by Alumina and Aluminum Production and Processing ($59,696), then Steel Product Manufacturing from Purchased Steel ($56,316). Over the last 10 years the annual wage in Primary Metal Manufacturing has risen by just over $15,000, an increase of 30.4 percent.
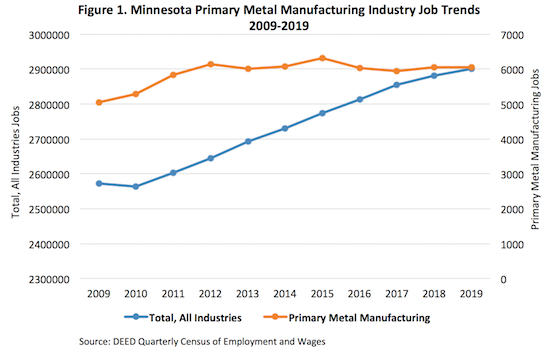
Both the total of jobs across all industries and those in Primary Metal Manufacturing saw job increases over the last decade. Since 2009 the total number of jobs across all industries increased by 12.8 percent while the number of jobs in Primary Metal Manufacturing saw an increase of 19.7 percent, equaling almost 1,000 additional jobs. However, since the peak of 6,320 jobs in 2015, Primary Metal Manufacturing has seen a small decline in jobs to the tune of 4.4 percent (see Figure 1).

Ambulatory Health Care Services makes up 31.2 percent of the total jobs in Health Care and Social Assistance and 5.4 percent of the total jobs across all industries in the State of Minnesota. The largest number of jobs are found in Offices of Physicians, which makes up almost half (47.3 percent) of all the jobs in Ambulatory Health Care Services. Additional sub-sectors in Ambulatory Health Care Services include Offices of Dentists (16,813 jobs), Offices of Other Health Practitioners (17,814 jobs), Outpatient Care Centers (12,169 jobs), Medical and Diagnostic Laboratories (2,454 jobs), Home Health Care Services (26,152 jobs), and Other Ambulatory Health Care Services (7,125 jobs) (see Table 1).
Table 1. Minnesota Ambulatory Health Care Services Industry Employment Statistics (2019)| Industry Title | Average Employment | Average Establishments | Total Payroll | Average Annual Wage |
|---|---|---|---|---|
| Total, All Industries | 2,900,881 | 178,094 | $172,989,740,202 | $59,644 |
| Health Care and Social Assistance | 501,295 | 18,286 | $27,117,925,176 | $54,080 |
| Ambulatory Health Care Service | 156,487 | 7,632 | $11,977,317,119 | $76,492 |
| Offices of Physicians | 73,959 | 1,596 | $7,822,258,416 | $105,716 |
| Offices of Dentists | 16,813 | 1,779 | $1,002,724,450 | $59,592 |
| Offices of Other Health Practitioners | 17,814 | 2,699 | $784,122,550 | $43,992 |
| Outpatient Care Centers | 12,169 | 489 | $934,854,684 | $76,804 |
| Medical and Diagnostic Laboratories | 2,454 | 128 | $169,307,739 | $69,004 |
| Home Health Care Services | 26,152 | 640 | $820,118,993 | $31,356 |
| Other Ambulatory Health Care Services | 7,125 | 303 | $443,930,287 | $62,296 |
| Source: DEED Quarterly Census of Employment and Wages | ||||
Also shown in Table 1, the average annual wage in Ambulatory Health Care Services rests at $76,492, which is 41.4 percent higher than the wages across the larger Health Care and Social Services sector and is 28.2 percent higher than the average annual wage across all industries. The largest average annual wages are seen in Offices of Physicians ($105,716), Outpatient Care Centers ($76,804), and Medical and Diagnostic Laboratories ($69,004). Over the last 10 years the average annual wages seen in Ambulatory Health Care Services has jumped by just over $14,400, an increase of 23.2 percent.
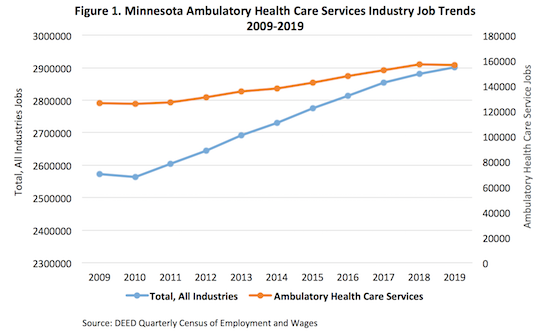
Both the total number of jobs across all industries and those in Ambulatory Health Care Services saw increases over the last 10 years. As shown in Figure 1, the number of jobs in Ambulatory Health Care Services rose by 30,432 over the last 10 years, an increase of 24.1 percent. Comparatively, the number of jobs across all industries increased at a rate of 12.8 percent. Over the last year, however, the number of jobs in Ambulatory Health Care Services declined slightly, losing 451 jobs (see Figure 1).

According to the U.S. Bureau of Labor Statistics, the Private Households industry "includes private households that engage in employing workers on or about the premises in activities primarily concerned with the operations of the household. These private households may employ individuals, such as cooks, maids, butlers, and outside workers, such as gardeners, caretakers, and other maintenance workers." Many in Minnesota hire nannies. Private Households makes up 6 percent of the total jobs in the Other Services (except Public Administration) sector (see Table 1).
Table 1. Minnesota Private Households Industry Employment Statistics (2019)| Industry Title | Average Employment | Average Establishments | Total Payroll | Average Annual Wage |
|---|---|---|---|---|
| Total, All Industries | 2,900,881 | 178,094 | $172,989,740,202 | $59,644 |
| Other Services (Except Public Administration) | 91,383 | 17,272 | $3,245,462,238 | $35,516 |
| Private Households | 5,446 | 5,128 | $102,680,571 | $18,824 |
| Source: DEED Quarterly Census of Employment and Wages | ||||
Also shown in Table 1, the average annual wage in the Private Households industry was $18,824 per year, which is 47 percent lower than the wages seen in the larger Other Services (except Public Administration) industry sector and 68.4 percent lower than the average annual wage across all industries. This low wage is likely caused by many of the jobs in this industry being part-time. For example, in the first quarter of 2019 the median hours worked in Private Households sat at 171 hours, whereas during the second quarter of 2019 the median hours worked dropped to 161 hours. Over the last 10 years the average annual wage actually decreased by $780, a decline of 4 percent.
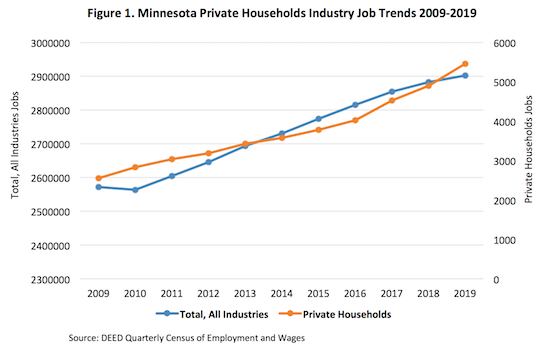
The number of jobs across all industries and in the Private Households industry have both seen increases over the last decade. Their rates of growth, however, varied tremendously. While the number of jobs across all industries rose by 12.8 percent during this time frame, the number of jobs in Private Households more than doubled, increasing by 114.2 percent. That's an increase of just over 2,900 jobs (see Figure 1).
