by Noah Aitoumeziane and Dave Senf
July 2019
Nearly every person consumes some product daily that initially was produced in the Crop and Production subsector. Industries in the Crop Production subsector are engaged in growing crops mainly for food and fiber. This subsector is made up of establishments such as farms, orchards, groves, greenhouses, and nurseries that are primarily engaged in growing crops, plants, vines, or trees and their seeds. A new type of crop was recently added to Minnesota’s crop mixture with the legalization of medical marijuana, included in NAICS 1114.
The employment discussed here is wage and salary employment directly involved in crop production and does not include self-employed farmers nor the jobs related to the processing of the different crops which is included in the Manufacturing sector. Minnesota has only 1.3 percent of nationwide employment in this subsector as much of the employment nationwide is involved in produce farming in states with warmer climates. Minnesota’s share of the U.S. employment in the oil and grain farming industry (NAICS 1111) is 4.5 percent. The top oil and grain farming industry in Minnesota is corn farming. Other important oilseed and grains produced in Minnesota include soybeans, wheat, sweet potatoes, barley, canola, and oats. The other major subsector in the state is Greenhouse, Nursery, and Floriculture production (see Table1).
| Table 1. Crop Production (NAICS 111), 2018 | |||
|---|---|---|---|
| Industry | Number of Firms | Employment | Average Weekly Wages |
| Crop Production (111) | 1,158 | 7,407 | $702 |
| Oilseed and Grain Farming (1111) | 651 | 2,472 | $724 |
| Vegetable and Melon Farming (1112) | 88 | 950 | $730 |
| Fruit and Tree Nut Farming (1113) | 29 | 295 | $345 |
| Greenhouse, Nursery, and Floriculture Production (1114) | 153 | 2,810 | $689 |
| Other Crop Farming (1119) | 237 | 879 | $793 |
Employment in Crop Production is seasonal with employment peaking during the harvest season and tapering off during the winter. Average weekly wages reflect the seasonal nature of work in Crop Production as the subsector's 2018 average weekly wage of $702 was 37 percent below the average weekly wage of total employment.
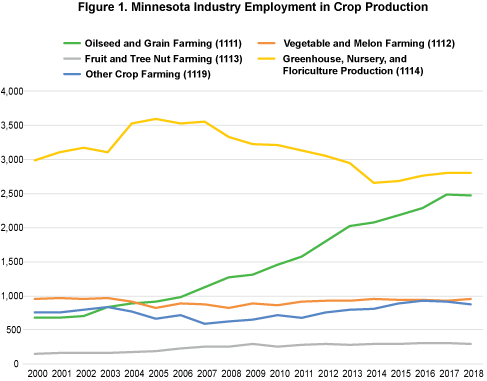
Crop Production employment has expanded three times faster than overall employment in Minnesota between 2000 and 2018. The 34 percent job growth over the 18 years in Crop Production employment is partly from more jobs in the subsector being covered by unemployment insurance than previously. Employment in this subsector has declined 5 percent nationally over the same period. Almost all of the employment growth has been generated in oilseed and grain farming (see Figure 1).

Slightly more than 100 occupations are involved in Crop Production with almost half of the workforce employed in the Farmworkers and Laborers, Crop, Nursery, and Greenhouse occupation (SOC 42092). Other top occupations in the subsector are Farm, Ranch, and Other Agricultural Managers (SOC 119013) and Heavy and Tractor-Trailer Truck Driver (SOC 533032). Median hourly wage for the three occupations in 2018 were $14.44, $47.01, and $23.42 respectively.
With the school year already in high gear, let's crack open our books and look at the statistics for the Educational Services subsector which accounts for roughly one of every eight jobs in Minnesota. Even though Minnesotans like to take pride in the educational opportunities available across the state Educational Services employment accounts for a smaller share of total employment in Minnesota, 8.0 percent, than the 8.6 percent share nationwide.
The 230,907 Educational Services jobs in Minnesota can be divided into private, state government, and local government jobs as this subsector, unlike most subsectors which are found only in the private sector, is a mix of private and public sector employment (see Table 1). Local government – public grade schools and high schools – accounted for 60 percent of the subsectors employment in 2018 while private schools – colleges, grade schools, high schools, and a variety of other types of education related companies – accounted for 22.5 percent, and state government (community and technical colleges, state colleges, and the University of Minnesota) accounted for the remaining 17.5 percent.
| Table 1. Educational Services (NAICS 611), 2018 | |||
|---|---|---|---|
| Number of Firms | Employment | Average Weekly Wages | |
| Total | 4,275 | 230,907 | $965 |
| State Government | 94 | 40,490 | $1,262 |
| Local Government | 1,640 | 138,282 | $934 |
| Private | 2,540 | 52,134 | $808 |
Seven industries make up the subsector with the first three industries a mix of public and private employment (NAICS 6111 – 6113) and the last four industries (NAICS 6114 – 6117) almost entirely private employment. Elementary and Secondary Schools (NAICS 6111) accounts for the largest percentage, 66 percent, of the subsector's employment. Colleges, Universities, and Professional Schools (NAICS 6113) employs 22 percent of the subsectors workforce, and Junior Colleges (NAICS 6112), known as community and technical colleges in Minnesota, accounts for 4 percent of employment. The remaining 8 percent of the workforce is spread across four mostly private sectors.
The enterprises in NAICS 6114 – 6117 range across schools for training in computers, business management, construction trades, art, sports, and languages. Also included are educational related services such as career counseling, educational testing, and tutoring.
Educational Services employs a wide range of occupations, hiring across 438 occupations that run from highly-educated college professors to less skilled jobs like janitors and bus drivers. The top three occupations are Teacher Assistants, Elementary School Teachers, and Secondary School Teachers. The wage and salary range reflects the wide range of occupations with average weekly wages in Educational Services varying from 24 percent above overall average weekly wage ($1,116) in the Business Schools and Computer and Training (NAICS 6114, $1,388) industry to 64 percent below the overall average wage in Other Schools and Instruction (NAICS 6116, $398).
Employment opportunities in the subsector have been excellent over the last two decades as the subsectors workforce has increased by 25 percent over the last 18 years compared to the 10 percent growth in overall employment.
Firms in this subsector manufacture products that generate, distribute, and use electrical power. Four industries make up the subsector. Electric Lighting Equipment Manufacturing companies (NAICS 3351) manufacture electric lamp bulbs, lighting fixtures, and parts. Firms in Household Appliance Manufacturing (NAICS 3352) produce both small and major electrical appliances and parts. Electric motors, generators, transformers, and switchgear apparatus are manufactured by firms in the Electrical Equipment Manufacturing industry (NAICS 3353). The Other Electrical Equipment and Component industry (NAIC 3359) makes devices for storing electrical power (e.g., batteries), for transmitting electricity (e.g., insulated wire), and wiring devices (e.g., electrical outlets, fuse boxes, and light switches).
Minnesota accounted for 2.1 percent of all U.S. employment in the subsector in 2018 which is just a tad higher than Minnesota's 2.0 percent of total U.S. employment. Because of non-disclosure rules only employment for two of the industries making up the subsector can be shown (Table 1). The two industries, Electric Equipment Manufacturing and Other Electrical Equipment and Component Manufacturing accounted for 85 percent of the subsector's jobs in Minnesota in 2018 which is up from 76 percent in 2000. The unavailability of employment records in the other two industries suggest that employment in the two industries is concentrated in several large firms. Most of the subsector's employment is located either in the Twin Cities Metro Area (52 percent) or in Southwest Minnesota (25 percent).
| Table 1. Electrical Equipment, Appliance, and Component Manufacturing (NAICS 335), 2018 | |||
|---|---|---|---|
| Industry | Number of Firms | Employment | Average Weekly Wages |
| Electrical Equipment, Appliance and Component Manufacturing (NAICS 335) | 183 | 8,244 | $1,327 |
| Electric Lighting Equipment Manufacturing (NAICS 3351) | NA | NA | NA |
| Household Appliance Manufacturing (NAICS 3352) | NA | NA | NA |
| Electrical Equipment Manufacturing (NAICS 3353) | 69 | 4,886 | $1,467 |
| Other Electrical Equipment and Component Manufacturing (NAICS 3359) | 90 | 2,149 | $1,205 |
Average weekly wages in the industry, $1,327, are 19 percent higher than average weekly wages for all employment ($1,116) and 3 percent higher than average weekly wages for all Manufacturing employment ($1,290). The subsector has the sixth highest average weekly wage among the 21 Manufacturing subsectors.
Employment in the subsector has tailed off over the last 18 years with employment declining 10 percent between 2001 and 2018. Most of the job cutbacks occurred between 2000 and 2003 when China joined the World Trade Organization. Jobs have disappeared in the subsector at a faster rate nationally as U.S. employment is down 28 percent since 2018.
Approximately 144 occupations staff this subsector's firms. Team assemblers (SOC 512092), Electrical and Electronic Equipment Assemblers (512022), and Electromechanical Equipment Assemblers (SOC 512023) account for 25 percent of total employment. Industrial Engineers (SOC 172112) and Electrical Engineers (SOC 172017) jobs are also leading occupations in the subsector accounting together for 6 percent of Electrical Equipment, Appliance, and Component Manufacturing employment.
This subsector is one of 12 subsectors that make up the Retail (NAICS 44, 45) sector. Firms in Non-store Retailers include mail-order houses, vending machine operators, home delivery sales, door-to-door sales, electronic shopping, and sales through portable stores such as street vendors. Yes, you will find some of the employment related to online commerce but not all since much of the employment being created by online shopping is related to delivery of purchases and is included in Wholesale (NAICS 42).
Non-store Retailer firms accounted for 3.9 percent of all Retail employment in the state in 2018 which is a tad larger than the 3.6 percent nationwide. Minnesota's share of U.S. Non-store Retailers' employment is 2.0 percent, the same as the state's overall employment share. Non-store Retailers are broken down into three industry groups with electronic shopping and mail-order houses (NAICS 4541 - this is the industry where some of the online shopping related employment is found) - accounting for 68 percent of the subsectors employment in Minnesota in 2018. Most of the rest of the subsector's employment is in the direct selling establishments industry group (NAICS 4543) (see Table 1).
| Table 1. Non-store Retailer (NAICS 454), 2018 | |||
|---|---|---|---|
| Industry | Number of Firms | Employment | Average Weekly Wages |
| Non-store Retailers (NAICS 454) | 1,193 | 11,685 | $1,294 |
| Electronic Shopping and Mail-Order Houses (NAICS 4541) | 439 | 7,975 | $1,459 |
| Vending Machine Operators (NAICS 4542) | 61 | 643 | $953 |
| Direct Selling Establishments (NAICS 4543) | 693 | 3,066 | $938 |
The average weekly wage in the subsector in 2018 was $1,294 or 16 percent higher than the average weekly wage for all jobs and more than double the average weekly wage for all Retail employment. Non-store Retailers jobs tend to be more full-time while in other Retail industry groups part-time jobs are the norm. Average weekly wages were especially high, $1,459, at electronic shopping and mail-order houses.
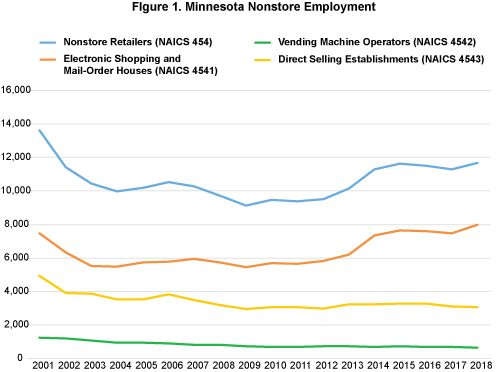
Employment in Non-store Retailers has decreased in Minnesota since 2000, slipping by 23.3 percent between 2000 and 2018 while expanding 16.8 percent across the U.S. Minnesota had several large mail-order houses during the early 2000s that lost business as Internet shopping expanded. The result was that nationally jobs in electronic shopping and mail-order houses surged by 58 percent but decreased in Minnesota by 7 percent between 2000 and 2018. Jobs have declined both in Minnesota and nationally over the same period in the other two industry groups (see Figure 1).

The top three occupations in Non-store Retailers are Industrial Truck and Tractor Operators (SOC 53-7051), Customer Service Representatives (SOC 43-4051), and Driver/Sales Worker (SOC 53-3031). These three occupations make up roughly 40 percent of the subsector's workforce. While Non-store Retailers employment nationwide is expected to increase by 10 percent over the next decade, employment in Minnesota is expected to be flat.