by Alessia Leibert
October 2015
Over the past several years rates of enrollment of students over age 25 has been on the rise. Today, the growth in the adult student population is one of the most significant trends in higher education. Adult students are likely to choose a sub-baccalaureate award (i.e., a certificate or Associate's degree) with flexible course scheduling that allows them to stay in their jobs and attend school part time. In Minnesota half (49 percent) of those who earned a sub-baccalaureate award as their highest degree from July 2009 to June 2012 were over 25 at the time of graduation, and 30 percent were over 30.
One of the main challenges to implementing performance measurement in post-secondary programs targeted at adult students, including job training programs, is the inappropriateness of indicators based on post-college experiences only, which fail to take into account the influence of pre-college work experience on job placement rates and earnings gains.
The question addressed by this article is how prior work experience can be measured and used to explain differences in labor market outcomes among older undergraduate completers. Measures of labor market success tailored around this emerging population of learners can help higher education institutions demonstrate impact and target student counseling activities to those most in need.
|
Data Sources The sources for all data in this article are the Minnesota Department of Employment and Economic Development Unemployment Insurance wage records and claims records and the Minnesota Office of Higher Education post-secondary graduation records. Included in the initial dataset 38,630 graduates who earned a sub-baccalaureate award from July 2009 to June 2012 at 133 private and public post-secondary institutions in Minnesota and were between 26 and 55 years of age at the time of graduation. Graduates who earned more than one degree during school years 2010, 2011, and 2012 were classified according to the highest degree obtained. Graduates older than 55 represented only 1.7 percent of the total and have been excluded for the sake of simplicity. Included in the smaller longitudinal dataset used for measuring wage outcomes 20,747 graduates who earned a one- to two-year award in Minnesota, were between 26 and 55 years of age at the time of graduation, had a valid Social Security Number, and were employed in Minnesota both three years before and three years after graduation. Graduates who were self-employed, employed with the federal government, or employed out of state are not included in the longitudinal dataset because they are not covered by Minnesota's Unemployment Insurance program. |
Non-traditional age undergraduate students consist of many subgroups, each with unique backgrounds, educational needs, and goals. They might be in school to improve their occupational skills to advance in their current career, prepare for a completely different career, or simply for enjoyment. Some may return to college after having dropped out because of personal, financial, or other reasons. Among those who completed a sub-baccalaureate award in Minnesota from July 2009 to June 2012, 62 percent were females and 70 percent graduated from a two-year community college.
To put a face on this diverse population let's look at majors where the greatest numbers of completers over age 30 were concentrated. The five largest sub-baccalaureate level majors with a proportion of older completers higher than 40 percent are shown in Figure 1.
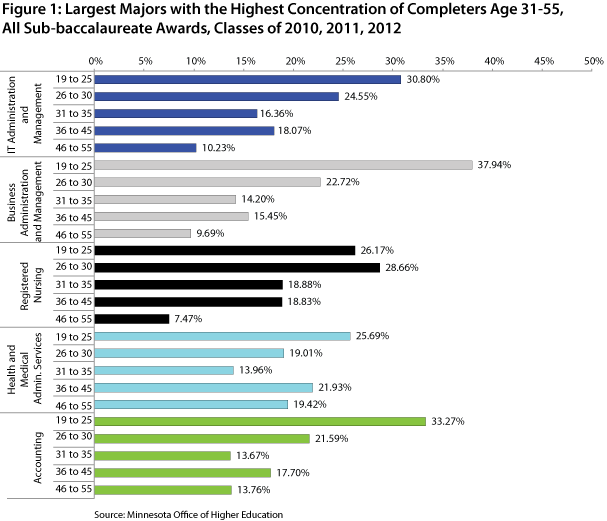
Their technical/occupational orientation makes them popular with adult learners as tickets for in-demand careers. For example, an Associate's degree in Registered Nursing is required to obtain a license to practice as an RN, and some Accounting programs meet the requirements to earn a CPA certificate.
Increased wages are a clear goal for investing in education. However, in the case of graduates over age 30 it is more difficult to quantify wage increases, let alone determine if they are attributable to educational attainment. Given their ages, many students were employed prior to enrollment, with different work histories leading to large disparities in earnings even when educational characteristics are the same.
As an example let's compare the experiences of three individuals who completed an Associate's degree in IT Network and System Administration. First, an IT desktop technician with 10 years of experience uses the newly acquired IT credential to get promoted to a supervisory role in the same firm. Second, a machinist uses the IT credential to apply for an entry-level job in IT after having lost his previous job in manufacturing. Third, a female engineering technician uses the IT credential to start a brand new career after having been out of the job market for three years to raise her children. Even if the program is exactly the same, the impact on individuals is likely to be different, with different baseline wages that will influence aggregate outcomes.
Table 1 compares outcomes for programs in similar majors but different participants' age mix. Associate's degree programs in Computer Programming in 2011 served predominantly young students. Aggregate results show first year wages of $13.95/hr, which in a young cohort represent initial earnings capacity. In contrast, Associate's degree programs in Network and System Administration had an older age profile with only 29 percent completing by age 25 and the remaining 71 percent completing after age 25. When the age distribution is skewed towards older completers, first year wages are likely to be higher and wage growth over time is likely to be slower. In this case Network and System Administration led to a median wage of $17.57/hr 12 months after graduation versus $13.95/hr in Computer Programming and a wage growth rate of 10 percent versus 20 percent in Computer Programming.
| Comparison of Earnings Outcomes for Students who Completed Associate's Degrees in Information Technology Majors With a Different Age Mix, Class of 2011 | |||||
|---|---|---|---|---|---|
| Major | Percent Students Older than 26 at Graduation | Median Hourly Wage 12 Months after Graduation | Median Hourly Wage 24 Months after Graduation | Net Wage Increase | Wage Growth |
| Computer Programming | 43% | $13.95 | $16.74 | $ 2.79 | 20% |
| Network and System Administration | 71% | $17.57 | $19.25 | $ 1.68 | 10% |
We can't tell from these results which program performed better because the concentration of older completers in the second program biases the comparison. A greater number of participants had prior work experience which led to higher wages after graduation.
A visual example will demonstrate the differences in earnings outcomes between younger and older completers. Using nine years of wage records we created a dataset of individuals who completed a one-to-two year award from July 2009 to June 20121. and had wage records in Minnesota both three years before graduation and again three years after graduation but were not necessarily employed every quarter in between. This approach allows us to track the same type of information on the same subjects over time.2. We then broke down completers into two age groups and compared their wages over a six-year period (Figure 2).
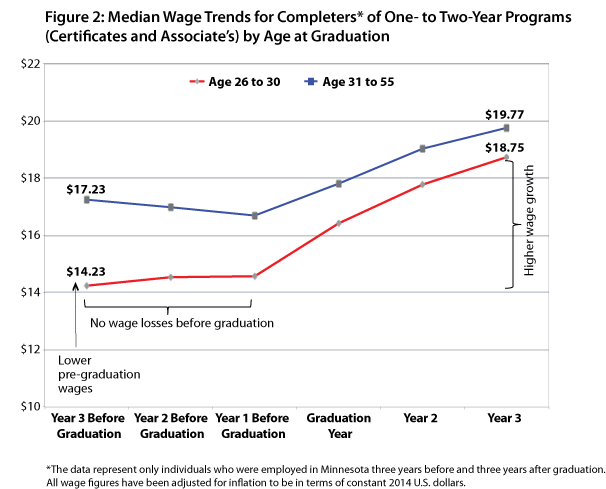
Looking at wages before, not just after graduation, reveals important differences. The 31 to 55 group, who had already begun a career before entering school, started from higher wages but suffered wage losses before graduation. Their aggregate real wages rebounded after graduation resulting in a six-year wage growth of 15 percent. The younger group started from median wages of $14.22/hr, much lower than the older cohort, and then experienced a 32 percent growth rate, double that of the older cohort.
Why do these age groups behave so differently? Here are a few possible explanations:
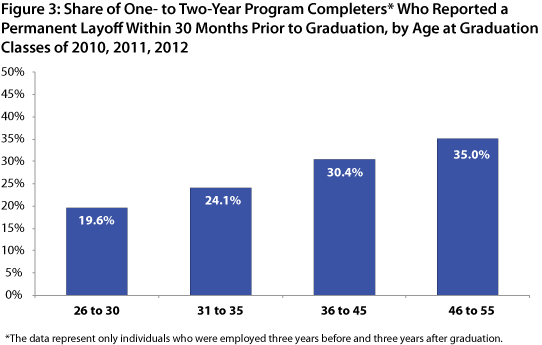
As shown in Figure 3, the 31 to 55 age group is more likely to represent individuals who experienced a permanent job loss before graduation. The presence of these individuals in the older cohort causes a downward trend in aggregate wages before graduation because the jobs that were lost paid more than the newly found ones. This demonstrates the importance of controlling for other factors besides age, for example the presence of a layoff.
The impact of educational attainment on earnings appears higher for younger students because employers tend to give more weight to academic credentials when they have little other information on work experience, as is often the case with candidates in their 20s. In contrast, older job applicants with gaps in work history or obsolete experience can face barriers even if they recently obtained a marketable credential.
There are diminishing returns on human capital investments such as education and on-the-job training. Even though 35 year olds may have the same marginal productivity as 65 year olds, as reflected in equal wage rates, the gains from investing in schooling are maximized right after high school and increase with age at a diminishing rate.3.
These are all reasons why programs serving predominantly older students cannot be expected to yield the same high rates of wage growth after graduation as programs with younger participants. The added value of schooling for adult learners is harder to demonstrate because their diverse backgrounds often mask some of the most positive effects. The remainder of the article will focus on strategies to overcome this challenge by correcting for work experience characteristics which skew aggregate earnings results.
Using nine years of Minnesota wage records and nine years of Unemployment Insurance claims records we identified three mutually exclusive work experience categories described below and illustrated in Figure 4:
Continuous Employment, defined as being employed every quarter from three years before to three years after graduation without reporting a permanent layoff prior to graduation. This group represented 44 percent of the total. Some people voluntarily switched jobs, but the majority - 58 percent - stayed with the same firm both before and after graduation. Tenure indicates that jobs before and after completion were in the same field, and employers might have offered tuition assistance and/or opportunities for professional growth within the organization.
Interrupted Employment, defined as not being employed every single quarter and not reporting a permanent layoff before graduation. This group represented 31 percent of the total. Reasons for interruptions in employment can vary from voluntarily quitting a job or taking time off work, to a temporary lay-off, or even a permanent layoff that was not eligible for UI benefits or was not reported. Not unexpectedly, tenure with the same employer is rare in this group, observed in only 22 percent of the cases.
Laid off from Employment, defined as having filed for Unemployment Insurance benefits as a permanently laid-off worker sometime within 30 months prior to graduation. These individuals, representing one fourth (25 percent) of the total, went back to school with a greater sense of urgency and stress than others. If jobs in their field disappeared during the Great Recession, they had no choice but to retrain in a new field in hopes of getting back to work at a family-sustaining wage. Gaps in employment were widespread: only 19 percent worked every quarter over the six year period. About one half (51.3 percent) of graduates in this group participated in a publicly funded re-employment program before graduation that may have included full tuition coverage. Finding these individuals, likely to be low-income, in the labor market three years after graduation is already a sign of success.
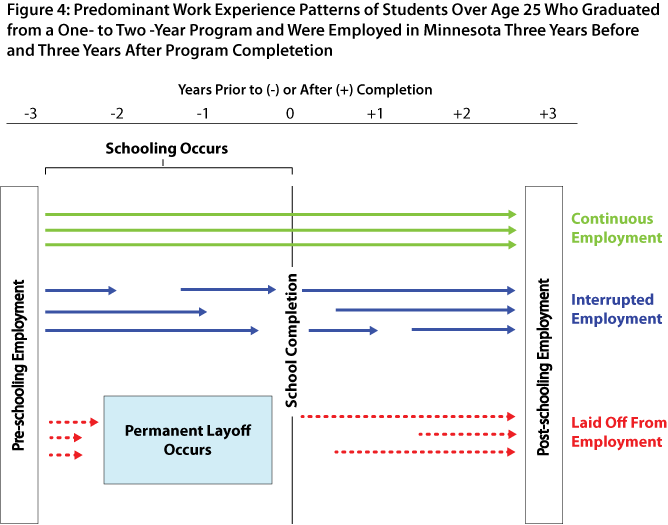
Although these categories are a simplification of extremely complex labor force participation dynamics, they capture the likely challenges faced after graduation. Understanding this is critical to establishing the right context and measurement baselines for interpreting earnings outcomes in such a diverse group of graduates.
Figure 5 shows pre- and post-graduation wages for individuals who were between 26 and 30 at graduation, comparing the three work experience groups to see if their outcomes look different.
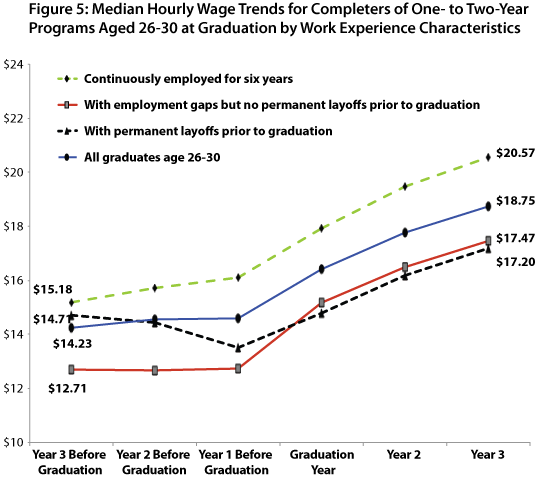
Wages three years before graduation, which we'll use as the baseline from which to measure net growth over six years, are pretty similar across groups. Each group experienced wage growth, but only the permanently laid-off saw earnings decline prior to graduation from involuntary job changes. Those with employment gaps but no permanent layoffs experienced flat wages prior to graduation followed by a rapid increase during graduation year, indicating that the new jobs paid better than the old ones. The group with no gaps in employment started with higher wages and experienced much smoother wage growth, typical of individuals who continue working in the same field or follow a fairly continuous career path.
The solid blue line, representing aggregate earnings for same-age individuals, shows six-year growth of 32 percent which is not too far from either group's outcome. Although this aggregate result hides differences in work experience patterns, it does not misrepresent the typical wage growth. This allows us to trust the aggregate results for younger completers even when participants come from diverse work experience backgrounds.
This is not true for completers over age 30 because the effect of prior work experience accumulates over time and widens the earnings gaps both before and after graduation. Figure 6 reveals the exact same trends as Figure 5 but with more dramatic differences across work experience characteristics. Wages three years before graduation ranged from $14.37 to $18.24/hr, and the gap grew bigger after graduation. Wages among the permanently laid-off dropped sharply before graduation and climbed slowly but not enough to avoid a 4 percent wage decline, while the continuously employed group enjoyed a smooth increase from a median of $18.24 to $22.91/hr (26 percent growth). This time the aggregate line, representing a 15 percent wage growth, is too simplistic as a measure, because it hides important differences in outcomes within this population of students.
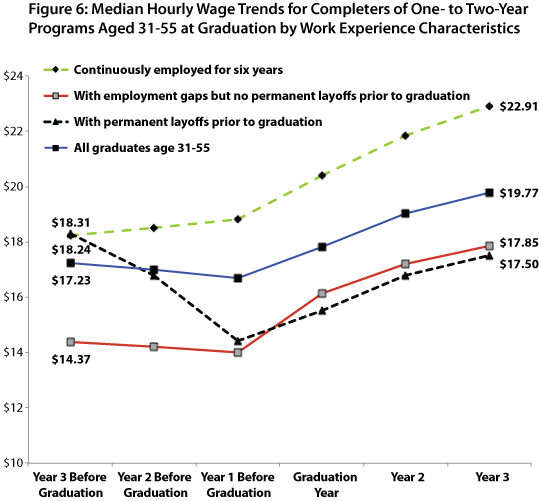
This example demonstrated how work experience characteristics, in addition to age, can help decompose the effects of schooling on earnings and set up peer comparison groups that more clearly reveal the added value of credentials attainment. Findings for each group will be presented next.
Figure 7 shows that individuals with steady employment and no permanent layoff had a smooth wage increase in every age group.
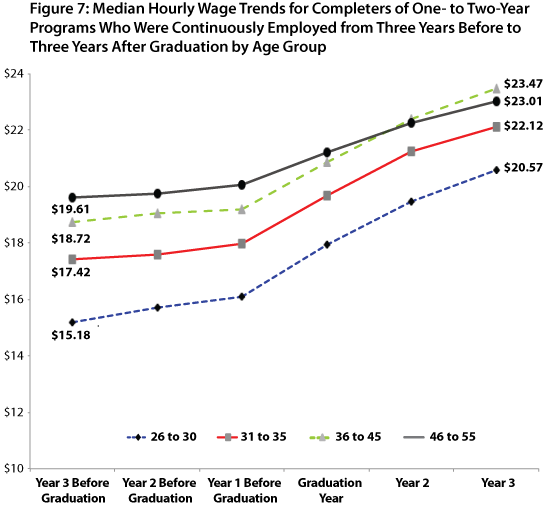
Correcting for work status has removed one of the main sources of disparity, revealing the net value of completing a credential. Still, even after this correction we see an age-related effect: earnings growth rates decline as age at completion increases. The 26 to 30 age group experienced a 35 percent wage growth compared to 17 percent among the 46 to 55 group. This evidence seems to confirm the theory of diminishing returns on human capital investment, with important implications for students. Since educational investments made late in life will have a shorter period of time over which the higher wages will be earned, high school students with an interest in furthering their education should be encouraged not to delay enrollment and completion of an undergraduate program.
A special case of continuous employment is represented by tenured individuals, defined here as individuals who worked at the same company before and after graduation for a total of at least four years. Tenure suggests that jobs before and after graduation were in the same field, and employers might have offered tuition assistance and opportunities for career advancement within the organization. Tenured individuals were overwhelmingly concentrated in the Healthcare sector (39 percent), particularly Hospitals, indicating the industry's commitment to investing in enhancing the skills of its incumbent workforce.
Individuals employed discontinuously encountered more difficulties in the labor market than those employed continuously but fared better than those with a permanent layoff. The overwhelming majority, 77 percent, switched employer and 68 percent switched industry after graduation, suggesting that a career change might have been a primary goal for returning to school. Lack of tenure has another important implication. This group is unlikely to have received tuition assistance or permission to take time off from their employer to attend school.
Findings are reported separately in the graphs below for males and females to illustrate how gender plays an important role in determining labor market outcomes for older students.4. Females, who represented 66 percent of completers in this group, started with median wages which were lower than males with similar age and education,5. but posted wage gains immediately after graduation indicating a successful re-integration into the job market (Figure 8).
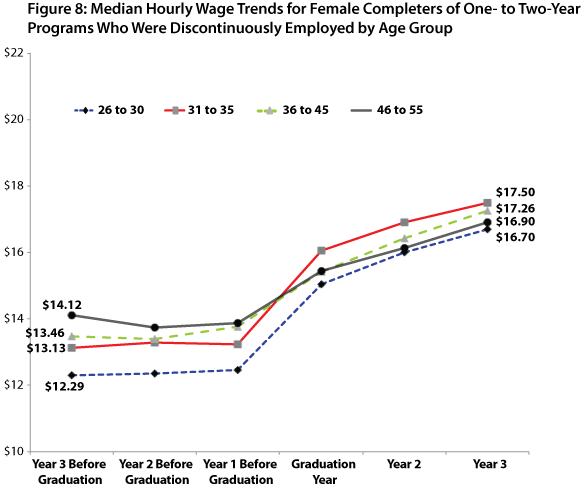
Not every major led to such positive outcomes. Women older than 30 who pursued an Associate's degree in Registered Nursing went from a median wage of $14.28/hr to $28.41/hr (almost 100 percent growth) while those who pursued a certificate or Associate's degree in Health and Medical Administrative Services went from $12.63 to $14.59/hr (15 percent growth). Earnings growth was also influenced by prior experience in a related industry and an individual's ability to enter a related industry after graduation. In both the case of Registered Nursing and Health and Medical Administrative Services, wages for individuals who were employed in the healthcare industry three years after graduation had grown more than twice as much relative to those who were employed outside the health care industry.
This leads to the important conclusion that prior work experience in a related industry in combination with an in-demand degree can make a big difference in the employment outcomes of adult learners.
Among males we observe much higher starting wages than among females, especially in the older and more experienced age groups (see Figure 9). Both males and females experienced stagnant or declining wages before graduation, suggesting that the necessity to schedule work around school pushed some students into lower-pay occupations. Wage declines were more common among men probably because 15 percent of them experienced temporary layoffs before graduation compared to 4 percent of women, and males' layoffs occurred predominantly in the construction field. Even if the layoffs were only temporary, the fact that they occurred in an industry that was losing jobs at a high rate during the prolonged housing market crisis forced individuals to work in unrelated fields for lower wages.
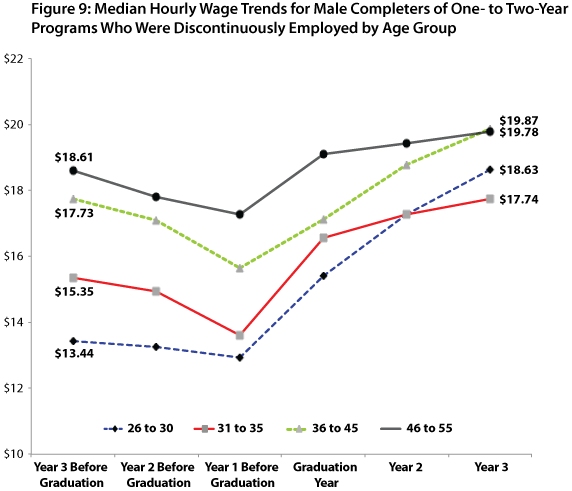
Wage growth over the six-year period was positive for every age and gender category indicating that the economic recovery combined with the completion of a credential helped people get back onto a career track or at least reverse a negative trend.
Individuals over age 35 are disproportionally represented in this group, making up 45 percent of the total. Although we do not know for sure what motivated them to enroll in school, a permanent layoff may have pushed some to seek job training who would otherwise never have chosen college as an option. Their outcomes are considerably worse than other groups because gaps in employment were longer and some of the jobs lost in the time period 2007-2010 did not come back despite the economic recovery.
Results for females, displayed in Figure 10, reveal how job losses affected different age groups differently. Only the youngest cohort (26 to 35) was able to post wage gains. Regardless of starting wage levels, all age groups ended up with median wages of about $16 an hour.
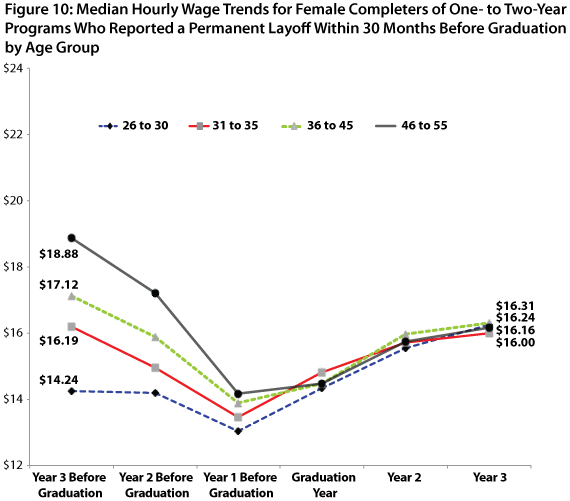
The 46 to 55 cohort was hit the hardest, experiencing a wage decrease of 14 percent, suggesting that some completers failed to get back into jobs that paid as well as those that were lost. Thirty-eight percent of these mid-aged women were laid off from clerical, low skilled jobs such as retail store assistants, customer service representatives, and book-keeping clerks. Previous low-skill work experience probably restricted their ability to achieve higher wages after graduation, and without re-training they may not even have found jobs.
Results for males tell a similar story. Only the young cohorts - 26 to 35 - achieved wage gains three years after graduation (see Figure 11). Older cohorts were laid off from jobs paying over $20 an hour and, taken as a whole, did not manage to get back into equally compensated jobs.
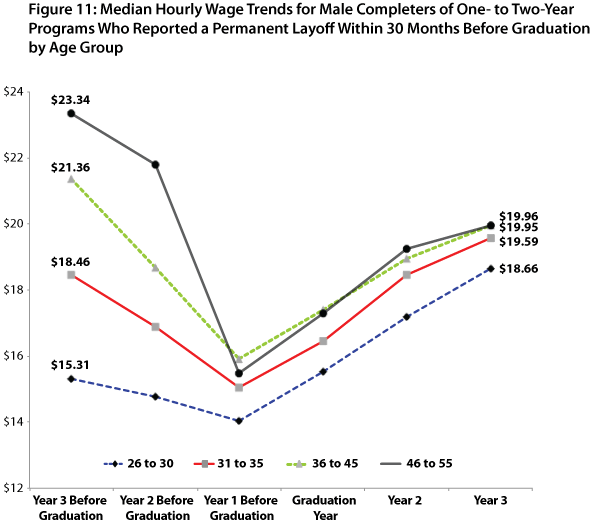
Twenty-eight percent of male completers over age 35 were laid off from Manufacturing jobs, especially Machinists, Assemblers, and Printing Machine Operators.6. Massive job losses in Manufacturing during the Great Recession forced individuals to re-train in other fields. Among graduates who had been laid off from production occupations only 31 percent chose to major in fields related to Manufacturing (Precision Production and Engineering Technologies), while the rest re-trained in a completely different field such as IT, Healthcare, and Business.
From this analysis we see that permanent job losses hurt more than temporary gaps in employment and that the youngest group of completers benefited the most from post-secondary education in terms of earnings growth under every work experience circumstance. In other words, investments in education at a younger age pay off more rapidly in the labor market, and work experience characteristics are not as consequential before age 30 as they are after age 30. Finally, perhaps an even more important question to ask for those who graduate after age 30 is what would labor market outcomes have been without training? Alternative labor market metrics presented next should also be taken into consideration when defining success for the older student population.
A discussion of labor market returns to college for older graduates would not be complete without mentioning the effect of schooling on employment. The value of education is not limited just to earnings but includes the likelihood of ensuring a job and increased working time after graduation. Since results vary dramatically by area of study, we will limit the presentation to the five majors mentioned at the beginning of the article and displayed in Figure 1.
Table 2 displays wages, employment, and full-time status for individuals who graduated between age 31 and 55 in those same majors.
| Table 2 | ||||||
|---|---|---|---|---|---|---|
| Wage and Employment Outcomes of One- to Two-Year Program Completers Age 31-55, Classes of 2010, 2011, 2012Examples of Majors with Highest Concentrations of Completers Age 30 | ||||||
| Major | Median Hourly Wage 2nd Year After Graduation by Gender | Percent With Wage Records in MN | Percent of Those With Wage Records That Were Employed Full-time Year-round | |||
| Males | Females | |||||
| Year Before Graduation | 2nd Year After Graduation | Year before graduation | 2nd Year After Graduation | |||
| Network and System Administration | $20.10 | $18.16 | 68.4% | 82.7% | 30.4% | 56.9% |
| Business Administration and Management | $20.57 | $19.05 | 76.0% | 81.1% | 54.6% | 58.9% |
| Registered Nursing | $29.04 | $27.39 | 80.0% | 88.5% | 15.4% | 41.3% |
| Health and Medical Administrative Services | $16.68 | $14.73 | 53.2% | 71.4% | 26.6% | 47.0% |
| Accounting | $17.07 | $16.07 | 67.8% | 83.6% | 37.1% | 50.3% |
We can notice that both gender and major influence outcomes, but choice of major matters more than gender. Women who completed a sub-baccalaureate award in Registered Nursing earned a median hourly wage of $27.39. This is $12 more than women who completed a certificate in Health and Medical Administrative Services. These differences stem from the types of careers each major prepares completers for and the level of demand compared to supply. Such low median wages for Health and Medical Administrative Services graduates indicate that many entered the desired career but had to start from bottom-level salaries or did not find a job in a field related to their academic background. Probably too many graduated in this field relative to the available job openings in careers such as Health Information/Medical Records Technicians, Medical Administrative Assistants, and Medical Secretaries.
In terms of employment, attaining a post-secondary credential had a positive impact both in terms of ensuring a job and increasing full-time year-round employment. Full-time employment increased dramatically from the year before graduation to two years after graduation especially in Nursing, indicating huge improvements in job quality.7.
Knowing participants' employment situation before graduation helps explain the impact of training. For example, we can tell that those who completed a program in Business were already stably employed the year before graduation. Seventy-six percent had jobs of which 54.6 percent were full-time. These individuals predominantly enrolled in school for professional development, not to rebound from a job loss. In contrast, almost half (47 percent) of those completing a program in Health and Medical Administrative Services had been out of the Minnesota labor market the year before graduation. An increase in employment from 53.1 to 71.4 percent represents an improvement given participants' circumstances prior to graduation.
This analysis demonstrates the need for taking into account non-wage labor market outcomes for programs that serve primarily older completers and the critical importance of providing guidance to adult students selecting a major.
The shift to an older age mix of college students has huge implications for educational program design, delivery, and accountability measurements. Post-secondary program planners and workforce program administrators need to be particularly careful when interpreting labor market outcomes for programs targeted at predominantly older participants. The intent of this study was to explain the challenges and propose a few strategies to analyze labor market outcomes for non-traditional age students.
Here is a summary of findings:
Starting college directly after high school has advantages in terms of future earnings potential. However, a variety of circumstances can create a need for older workers to pursue training to transition to new careers or upgrade their skills. The market value of educational programs that predominantly serve non-traditional age participants should be measured through more years of data, not just immediately after graduation, and non-wage metrics such as employability, job stability, and increases in hours worked. Ideally, comparison groups should be based not only on age and educational characteristics but also on work experience characteristics.
Work experience characteristics accumulate over a person's life, influencing not only the reasons and timing for adults returning to school but also their chances of success after completion of an academic credential. Since some patterns of education and work experience lead to better outcomes than others, finding the right type of training is as important to labor market success as completing a credential. It is critical that older students be guided towards in-demand fields where they can leverage their previous work experience without taking too much time away from the labor market for their educational investments to be worthwhile.
While the analysis outlined in this article relies on data sources not readily available to researchers and practitioners, it introduces the types of analyses that can be done with longer time series of data. Given the rising importance of non-traditional students, educators and policy-makers need a more tailored approach to measure success and track their progress in meeting adult learners' diverse educational needs.
1. The analysis focuses on sub-baccalaureate awards of one to two years in length (certificates or Associate's Degrees) because we expect a higher market value for those than for shorter awards.
2. Although individuals who temporarily exited and then re-entered the labor market are not captured in all cross-sectional observations, they are captured in the first and last observations.
3. According to University of Chicago's Gary Becker's theory of human capital (Human Capital, 1964), additional earnings attributable to human capital obtained from work experience are subject to diminishing returns. As workers approach retirement, average earnings tend to decrease.
4. We excluded from the wage comparison individuals who re-enrolled in school after graduation and completed a higher degree in 2013, because gaps in employment are likely to be caused by prolonged schooling and wages might reflect a higher educational attainment. They represented only 3.7 percent of this group.
5. Gender differences grow larger with age because they are correlated with other differences that play out over one's life, including choice of major and work participation patterns.
6. Unemployment Insurance claims data also include information on occupation of employment at the time of layoff, which helps us better understand the challenges faced by this group of students.
7. Full-time year-round employment is an indicator of job quality because it is typically associated with access to health care and/or retirement benefits.