
by Mustapha Hammida
September 2023
A recently published article by Mustapha Hammida, which concludes a three-part series on Minnesota's wage distribution, focuses on the factors driving the growth in the Aggregate Average Hourly Wage (AAHW). This is a summary of that article. It examines the pure wage effect and composition effect as contributors to AAHW growth, quantifies the impact of different determinants on the composition effect, and analyzes their influence before, during, and after the Pandemic Recession.
The analysis spans the six-year period from the first quarter of 2017 to the third quarter of 2022 and utilizes individual-level data obtained from the Minnesota Unemployment Insurance (UI) Wage Detail Report and focuses on different categories of workers based on their employment history and attachment status.
The pure wage effect is the result of wage increases or decreases in the existing workforce. The composition effect results from movements of workers into and out of employment that impact the wage distribution and the changes in wages of workers who leave employment and those of workers who enter employment.
As the COVID-19 pandemic struck Minnesota, it caused significant job losses, which predominantly affected lower-wage workers. These job losses shifted the wage distribution towards higher wages (the composition effect), even as the wages of continuously employed workers remained unchanged. This shift, a common occurrence during recessions, distorts distribution statistics such as the AAHW.
Average hourly wages of continuously employed workers, those who remain with the same employer (stayers), have consistently increased year-over-year, with accelerated growth during the current recovery. Stayers and changers (workers who change jobs) experienced significant year-over-year growth rates of 8.3% and 8.9%, respectively. Stayers have average hourly wages 1.5 times higher than those who change employers (changers).
While "pure" wage growth was 8.4% during the current recovery, the growth in AAHW was only 5.0%. The difference is due to changes in the composition of the workforce. Overall, the composition effect has averaged -2.0% since the first quarter of 2018, meaning that measured AAHW growth underestimates actual wage growth by an average of 2.0 percentage points. The composition effect varied throughout the business cycle, ranging from -2.1% before COVID-19 to 0.2% during the Pandemic Recession, and -3.4% during the current recovery. The recent high rate is attributed to an increase in entrants and a decrease in leavers.
The sign of the composition effect is determined by the state of the labor market across the business cycle. During expansions, with a greater share of entrants and declining shares of stayers and changers, a negative composition effect arises. The opposite occurs during recessions.
Methodology: This analysis utilizes individual-level data obtained from the Minnesota Unemployment Insurance Wage Detail Report and focuses on different categories of workers based on their employment history and attachment status. The study methodology measures the changes in the quarterly average hourly wage of workers over a year, comparing two identical quarters of successive years. The analysis classifies jobs held by individuals into three categories: continuous, new hire, and exit jobs. Additionally, workers are categorized into stayers, changers, leavers, and entrants based on their employment attachment status in similar quarters of two successive years. Changes in the hourly wages of each worker type are tracked over time and form the basis of growth in the AAHW. A shift-share analysis is used to decompose the change in the AAHW into its pure wage growth and decomposition effect.
Figure 1 presents the quarterly distributions of workers by employment status in the previous year (t-1) and the current year (t). The analysis reveals that the composition of the workforce varies between the two periods, with stayers, changers, leavers, and entrants accounting for different shares in each quarter. It is important to note that the distributions change quarter by quarter, indicating the dynamic nature of the workforce composition.
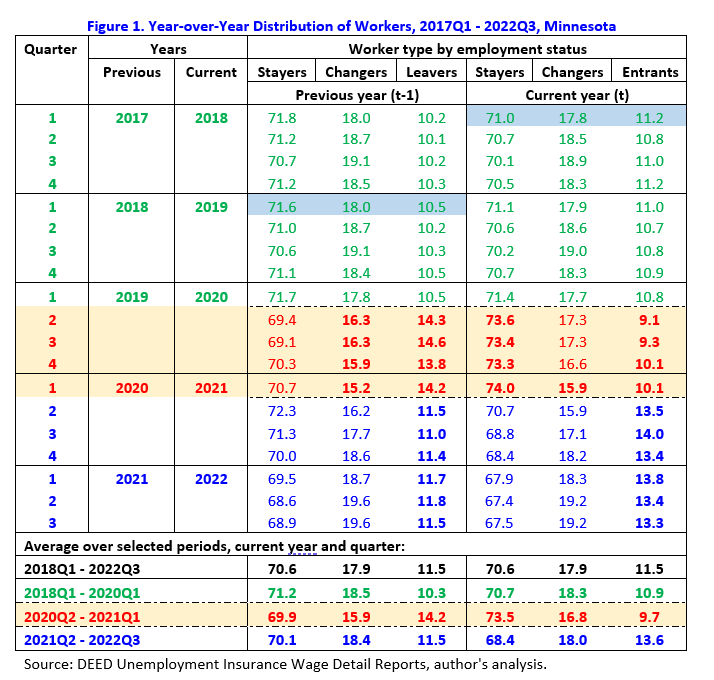
On average, stayers constitute the largest share of the workforce, accounting for 70.6%, followed by changers at 17.9%, and leavers and entrants each represent 11.5% of the distribution. However, these equal shares are a statistical artifact resulting from opposing movements across different stages of the business cycle over the analyzed period. Nevertheless, even during distinct periods affected by the COVID-19 pandemic, the dominance of stayers remains evident, highlighting the responsiveness of the workforce composition to economic fluctuations.
Impact of Business Cycle: The report identifies three distinct periods based on the effect of the COVID-19 pandemic on economic activity. The first period, prior to the Pandemic Recession, spans nine quarters from Q1 2018 to Q1 2020. During this period, stayers and changers accounted for higher shares in the previous quarter, while leavers and entrants were more prominent in the current quarter. The second period, encompassing the Pandemic Recession, saw a reversal in the distribution of worker types, with leavers surpassing entrants. Finally, the ongoing recovery phase shows a return to pre-pandemic patterns, with stayers reclaiming their dominance in the workforce (see Figure 1).
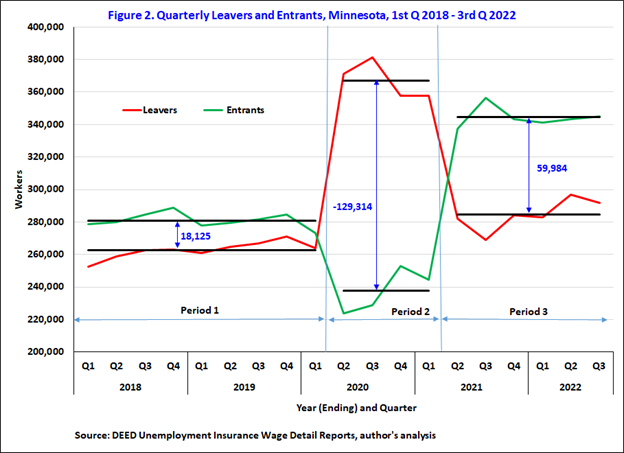
The distribution of workers by employment status in Minnesota demonstrates the ever-changing nature of the workforce composition. Stayers consistently form the largest group, but the shares of other worker types fluctuate in response to economic conditions and external shocks. As Figure 2 shows, the COVID-19 pandemic significantly impacted the shares and numbers of leavers and entrants, leading to shifts in the overall distribution.
Figure 3 shows the year-over-year percent change in the average hourly wage of all workers, stayers, changers, and leavers. It also compares the average hourly wage of leavers to that of entrants.
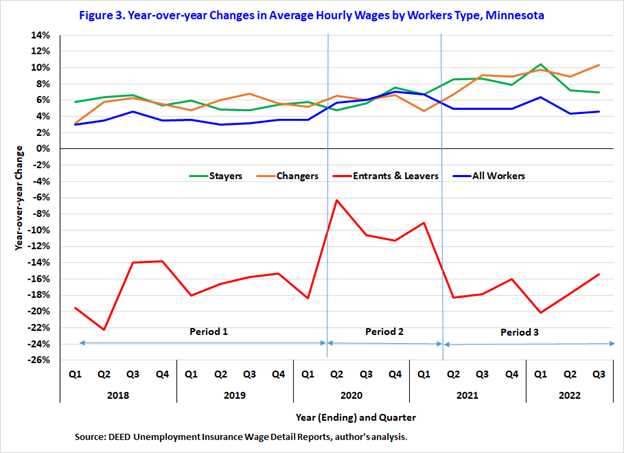
This analysis reveals several key findings:
Decomposition of the growth in the AAHW: Growth in the AAHW can be decomposed into the pure wage effect and the compositions effect. The pure wage effect focuses on the wage change for continuously employed workers (stayers and changers) and is generally smaller than the growth in AAHW.
Figure 4 estimates the quarterly composition effect. Three conclusions can be drawn from this analysis:
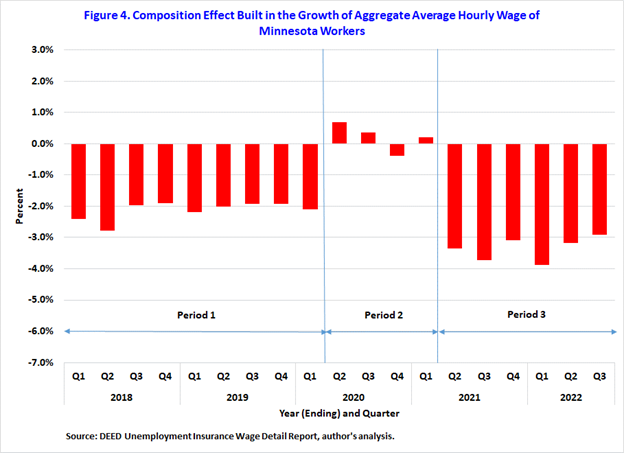
The impact of the composition effect on real wage growth is shown in Figure 5. The negative values of the composition cause drag on average hourly wage growth during the first and third periods (both period of economic growth) and cause an underestimation of pure wage growth. During the last two years of the previous economic expansion, while growth in AAHW was 3.5%, pure wage growth, or growth in the wages of the continuously employed workers, was 5.6%.
During the third period, the period of economic expansion after the Pandemic Recession, the high number of leavers and the soaring numbers of entrants coupled with a widening in their respective average hourly wages are exerting a powerful drag down on the growth of AAHW. As a result, this measure of wage growth discounts the significant leaps currently occurring in the wages of both stayers and changers.
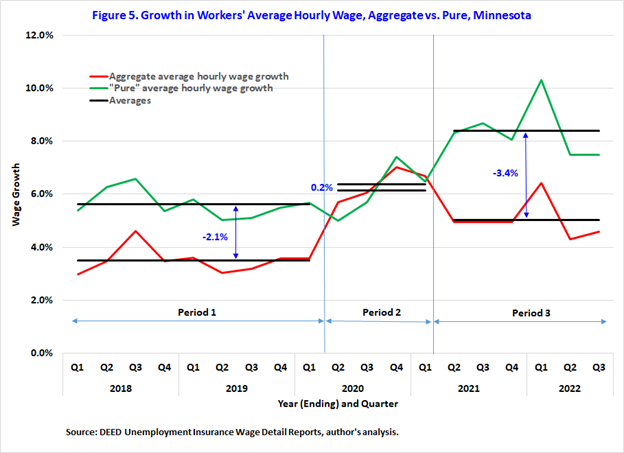
The report provides specific examples of the composition effect during the Pandemic Recession and the recovery from COVID-19, highlighting the opposing forces and their impacts on AAHW growth.
Overall, the analysis demonstrates the importance of considering both the pure wage effect and the composition effect when examining changes in average hourly wages over time.
Conclusion: Changes in the AAHW are a good measure of the general health of the economy. However, growth in the AAHW captures not only growth of wages of workers who are continuously employed, but also changes in the composition of who is working at the times of AAHW measurement. These changes bias growth in the AAHW and the impact of this bias is influenced by the business cycle.
The compositional effect is counter-cyclical and significantly dampens the wage growth profile during periods of economic recovery and expansion because it overrepresents the impact of entrants and leavers. The composition effect is larger during the recovery from the Pandemic Recession than it was prior to COVID-19. The current high levels of the composition effect are driven by the enduring high levels of leavers and entrants.
Growth in the average hourly wages of continuously employed workers (pure wage effect) has been very strong with both stayers and changers posting exceptional wage growth since the end of the Pandemic Recession although it has been dragged down by the composition effect when measured by the AAHW. Understanding these dynamics is crucial for policymakers and analysts seeking to gauge the health of the labor market and devise appropriate strategies for economic recovery and stability.