by Mark Schultz
February 2019
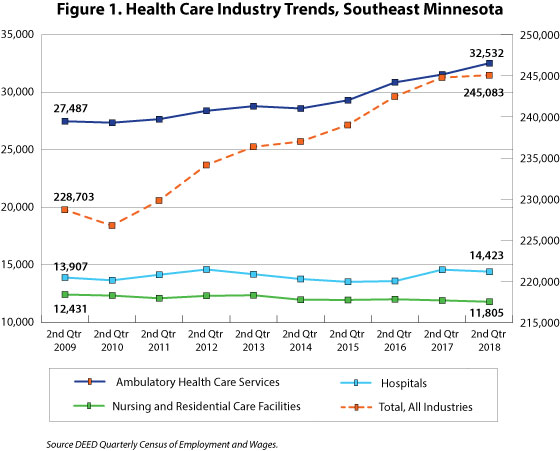
Health care is a dominant economic force in the Southeast region. From an industry perspective, health care is divided into three separate sub-sectors: ambulatory health care services, nursing and residential care facilities, and hospitals. Over the last 10 years, based on 2nd quarter job estimates for 2009 to 2018, two of these three health care subsectors have seen an increase in jobs. Leading the way was ambulatory health care services, which saw an 18.4 percent increase in the number of jobs, equaling an additional 5,045 jobs in the region, followed by jobs in hospitals which rose by 3.7 percent or 516 jobs. Nursing and residential care facilities, on the other hand, saw a 5 percent decline, equaling a drop of 626 jobs.

Health care practitioners and technical occupations are the second highest employing occupational group in the region, just behind office and administrative support (Table 1). Overall, health care practitioners and technical occupations make up 11.3 percent of the total employment in the region with a location quotient of 1.8 which demonstrates a higher employment concentration in the region compared to that of the state. When occupations in health care support, which has a location quotient of 1.3, are added to the equation, health care becomes the highest employing occupational group in the region, making up 15.3 percent of total employment. In comparison, statewide health care practitioner and technical occupations make up only 6.4 percent of total statewide employment, jumping only to 9.4 percent with the addition of health care support occupations.
| Table 1. Percent of Total Employment by Occupational Group, Southeast Minnesota | ||||
|---|---|---|---|---|
| Occupational Group | Southeast | Percent | Minnesota | Percent |
| Total, All Occupations | 238,090 | 100.0% | 2,838,270 | 100.0% |
| Office and Administrative Support | 31,810 | 13.4% | 409,820 | 14.4% |
| Health Care Practitioners and Technical | 26,950 | 11.3% | 182,500 | 6.4% |
| Production | 26,120 | 11.0% | 217,610 | 7.7% |
| Sales and Related | 20,370 | 8.6% | 277,720 | 9.8% |
| Food Preparation and Serving Related | 20,230 | 8.5% | 239,950 | 8.5% |
| Transportation and Material Moving | 14,660 | 6.2% | 178,720 | 6.3% |
| Education, Training, and Library | 14,620 | 6.1% | 163,850 | 5.8% |
| Management | 11,410 | 4.8% | 168,930 | 6.0% |
| Health Care Support | 9,610 | 4.0% | 85,940 | 3.0% |
| Personal Care and Service | 9,130 | 3.8% | 139,210 | 4.9% |
| Installation, Maintenance, and Repair | 8,240 | 3.5% | 95,660 | 3.4% |
| Business and Financial Operations | 7,820 | 3.3% | 161,080 | 5.7% |
| Construction and Extraction | 7,600 | 3.2% | 99,900 | 3.5% |
| Building and Grounds Cleaning and Maintenance | 7,580 | 3.2% | 84,300 | 3.0% |
| Computer and Mathematical | 5,510 | 2.3% | 94,290 | 3.3% |
| Community and Social Services | 4,340 | 1.8% | 55,430 | 2.0% |
| Architecture and Engineering | 3,390 | 1.4% | 53,780 | 1.9% |
| Protective Service | 3,160 | 1.3% | 43,150 | 1.5% |
| Arts, Design, Entertainment, Sports, and Media | 2,590 | 1.1% | 36,910 | 1.3% |
| Life, Physical, and Social Science | 1,920 | 0.8% | 26,220 | 0.9% |
| Legal | 610 | 0.3% | 19,750 | 0.7% |
| Farming, Fishing, and Forestry | 410 | 0.2% | 3,540 | 0.1% |
| Source: DEED Occupational Employment Statistics | ||||
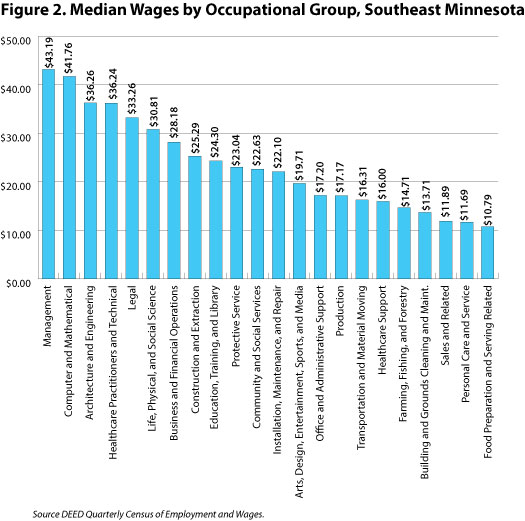
Wages for both health care practitioners and support occupations are nothing to scoff at either. As shown in Figure 2, median health care wages range from $36.24 for practitioners and technical occupations to $16.00 per hour for support. To put that into perspective, the wages needed for the typical family to meet the basic cost of living needs in the region rest at $16.17 – well covered by practitioner and technical occupations and just missing the mark for support occupations. Within both occupational groups, practitioner and technical wages range from $15.14 for veterinary technologists and technicians to over $100 per hour for occupations such as dentists, anesthesiologists, internists, physicians and surgeons, while in support occupations the wages range from $11.81 for pharmacy aides to $24.54 for physical therapy assistants.

Currently there are over 9,600 job vacancies in the Southeast region with almost 14 percent of those in health care - 9.8 percent in health care practitioners and technical and another 4.1 percent in health care support. In general, support occupations have a higher percentage that are part-time while very few in either group are temporary or seasonal. While post-secondary education appears to be extremely important for the health care practitioner and technical openings, many fewer of the vacancies in health care support require education beyond high school. The same holds true for work experience requirements, where 35 to 100 percent of the vacancies for health care practitioners and technical require one or more years of experience but only 9 to 24 percent of the support vacancies require experience (Table 2).
Table 2. Health Care Job Vacancies, Southeast Minnesota| Occupations | Vacancies | Median Wage Offer | Part-Time | Temporary or Seasonal | Requires Post-Secondary Education | Requires 1+ Years Experience |
|---|---|---|---|---|---|---|
| Total, All Occupations | 9,641 | $14.83 | 35% | 9% | 29% | 38% |
| Health Care Practitioners and Technical Occupations | 942 | $27.35 | 34% | 1% | 91% | 63% |
| Health Diagnosing and Treating Practitioners | 529 | $32.63 | 30% | 2% | 100% | 85% |
| Health Technologists and Technicians | 406 | $18.51 | 40% | 1% | 80% | 35% |
| Other Health Care Practitioners and Technical | 7 | $24.72 | 27% | 0% | 100% | 100% |
| Health Care Support Occupations | 400 | $13.17 | 54% | 2% | 35% | 10% |
| Nursing, Psychiatric, and Home Health Aides | 366 | $13.03 | 55% | 2% | 33% | 9% |
| Other Health Care Support Occupations | 31 | $17.07 | 39% | 0% | 55% | 24% |
| Source: DEED Job Vacancy Survey | ||||||
Health care looks to have a bright future, considering the number of openings projected from 2016 to 2026. Both health care practitioners and technical and health care support are anticipated to see job growth during this time, with the former seeing about 3,320 new job openings and an additional 854 for health care support. In addition to this job growth, there are predicted to be many more additional openings both from labor force exits (incumbents leaving the occupation and/or labor force) and occupational transfer openings (incumbents going from one job to another). In fact, health care practitioners are expected to see a need for over 15,400 workers to fill openings left from exits and transfers while over 12,600 health care support workers will be needed to fill openings for these two reasons. In all, projected openings for health care practitioners and technical occupations make up 6.1 percent while support occupations are expected to comprise an additional 4.4 percent of the total openings projected during this 10 year period. By far, the largest need for workers is expected for registered nurses, LPN's, and both nursing and medical assistants.
Current labor market data show that health care is a dominant industry and occupational group in the Southeast Economic Development Region, seeing an overall increase in jobs over the last 10 years, making up a large portion of current employment, having a large number of current vacancies, and projected to see a sizable portion of future job openings. Whether you are a young person starting your education or career or someone looking to move on to a new career, current regional residents as well as non-residents looking to move elsewhere are likely to find work in health care in Southeast Minnesota.
| Table 3. Employment Projections, Southeast Minnesota (2016-2026) | |||||
|---|---|---|---|---|---|
| Title | Percent Change | Total Change | Labor Force Exit Openings | Occupational Transfer Openings | Total Hires |
| Total, All Occupations | 4.6% | 12,498 | 129,847 | 164,818 | 307,163 |
| Health Care Practitioners and Technical | 12.3% | 3,320 | 7,802 | 7,631 | 18,753 |
| Registered Nurses | 11.3% | 1,273 | 3,400 | 2,582 | 7,255 |
| Licensed Practical and Licensed Vocational Nurses | 8.3% | 167 | 743 | 732 | 1,642 |
| Emergency Medical Technicians and Paramedics | 27.2% | 259 | 188 | 444 | 891 |
| Pharmacy Technicians | 2.8% | 29 | 343 | 469 | 841 |
| Radiologic Technologists | 14.2% | 109 | 212 | 204 | 525 |
| Medical Records and Health Information Technicians | 13.3% | 90 | 212 | 215 | 517 |
| Pharmacists | 4.0% | 30 | 175 | 146 | 351 |
| Dental Hygienists | 11.4% | 47 | 158 | 98 | 303 |
| Physical Therapists | 15.7% | 62 | 82 | 89 | 233 |
| Opticians, Dispensing | -1.9% | -6 | 104 | 116 | 214 |
| Nurse Anesthetists | 15.1% | 49 | 48 | 115 | 212 |
| Veterinary Technologists and Technicians | 6.6% | 15 | 76 | 104 | 195 |
| Occupational Therapists | 10.4% | 26 | 54 | 73 | 153 |
| Dietitians and Nutritionists | 13.6% | 25 | 62 | 56 | 143 |
| Speech-Language Pathologists | 6.2% | 13 | 39 | 68 | 120 |
| Dentists, General | 10.3% | 22 | 41 | 17 | 80 |
| Ophthalmic Medical Technicians | 14.6% | 12 | 29 | 39 | 80 |
| Veterinarians | 4.7% | 8 | 33 | 29 | 70 |
| Athletic Trainers | 13.8% | 12 | 21 | 25 | 58 |
| Recreational Therapists | 3.8% | 2 | 15 | 14 | 31 |
| Chiropractors | 7.1% | 6 | 15 | 7 | 28 |
| Audiologists | 16.7% | 6 | 10 | 8 | 24 |
| Surgeons | 11.8% | 2 | 3 | 2 | 7 |
| Health Care Support | 7.8% | 854 | 6,520 | 6,131 | 13,505 |
| Nursing Assistants | 1.4% | 54 | 2,384 | 1,984 | 4,422 |
| Medical Assistants | 27.4% | 406 | 739 | 1,034 | 2,179 |
| Dental Assistants | 11.4% | 50 | 237 | 266 | 553 |
| Massage Therapists | 11.5% | 26 | 156 | 86 | 268 |
| Veterinary Assistants and Lab Animal Caretakers | 8.8% | 12 | 83 | 134 | 229 |
| Physical Therapist Assistants | 17.0% | 16 | 45 | 75 | 136 |
| Occupational Therapy Assistants | 8.7% | 4 | 24 | 34 | 62 |
| Source: DEED Employment Outlook | |||||