by Erik White
May 2020
The Northwest planning region consists of 26 counties covering a significant area. Within the region there exists a diverse range of economies from the agriculture of the Red River Valley to the tourist industries anchored to the many lakes and natural amenities in the area.
Crow Wing is the largest employing county in the planning region with nearly 30,000 jobs. Otter Tail (22,813), Beltrami (20,181), Clay (19,379), and Douglas (19,347) counties had employment near 20,000 with another five counties in the planning region that had more than 10,000 jobs. Meanwhile, there were seven counties that had less than 2,000 jobs indicating smaller and more rural economies within the region.
Overall, Northwest Minnesota has gained 6,750 jobs in the past five years, a 3.1 percent increase that is considerably less than the state rate of 6.2 percent growth since 2014. However, much of the employment gains in the region have been from larger counties gaining jobs as the six biggest counties all have increased employment while smaller counties in the region are more likely to have experienced job losses (Table 1).
Table 1. Industry Employment Statistics, Northwest Minnesota| County | 2019 Annual | 2014-2019 Change | ||||
|---|---|---|---|---|---|---|
| Number of Employees | Number of Firms | Total Payroll | Avg. Annual Wage | Number | Percent | |
| Northwest Minnesota | 223,144 | 17,145 | $9,309,828,096 | $41,704 | 6,750 | 3.1% |
| Crow Wing County | 29,755 | 2,165 | $1,241,872,068 | $41,704 | 1,522 | 5.4% |
| Otter Tail County | 22,813 | 1,798 | $929,435,555 | $40,768 | 475 | 2.1% |
| Beltrami County | 20,181 | 1,243 | $879,220,135 | $43,524 | 1,398 | 7.4% |
| Clay County | 19,379 | 1,387 | $813,971,899 | $41,964 | 924 | 5.0% |
| Douglas County | 19,347 | 1,410 | $845,516,605 | $43,680 | 1,370 | 7.6% |
| Becker County | 14,646 | 1,033 | $593,916,356 | $40,560 | 758 | 5.5% |
| Polk County | 12,146 | 998 | $510,512,777 | $41,964 | -88 | -0.7% |
| Morrison County | 10,724 | 983 | $413,052,978 | $38,480 | 149 | 1.4% |
| Cass County | 10,517 | 894 | $346,477,158 | $32,968 | 536 | 5.4% |
| Pennington County | 10,186 | 410 | $464,614,714 | $45,604 | -102 | -1.0% |
| Roseau County | 7,827 | 460 | $377,185,762 | $48,204 | -1,084 | -12.2% |
| Todd County | 6,494 | 592 | $275,203,797 | $42,328 | 493 | 8.2% |
| Hubbard County | 6,195 | 624 | $245,583,870 | $39,624 | 428 | 7.4% |
| Stevens County | 5,517 | 349 | $267,581,944 | $48,464 | 176 | 3.3% |
| Wadena County | 5,508 | 430 | $217,270,058 | $39,416 | -244 | -4.2% |
| Pope County | 4,489 | 358 | $198,181,451 | $44,148 | 294 | 7.0% |
| Clearwater County | 2,608 | 229 | $108,560,091 | $41,548 | 1 | 0.0% |
| Marshall County | 2,235 | 324 | $99,229,315 | $44,252 | -143 | -6.0% |
| Grant County | 1,904 | 263 | $74,214,806 | $38,896 | -24 | -1.2% |
| Mahnomen County | 1,852 | 116 | $69,644,444 | $37,596 | -60 | -3.1% |
| Wilkin County | 1,795 | 208 | $77,574,350 | $43,212 | -215 | -10.7% |
| Lake of the Woods County | 1,717 | 169 | $63,012,355 | $36,660 | 133 | 8.4% |
| Norman County | 1,582 | 242 | $61,974,894 | $39,156 | -98 | -5.8% |
| Kittson County | 1,505 | 186 | $56,365,189 | $37,388 | 20 | 1.3% |
| Traverse County | 1,177 | 152 | $42,311,351 | $35,932 | 122 | 11.6% |
| Red Lake County | 1,040 | 124 | $37,344,174 | $35,880 | 11 | 1.1% |
| Source: DEED's Quarterly Census of Employment and Wages (QCEW) | ||||||
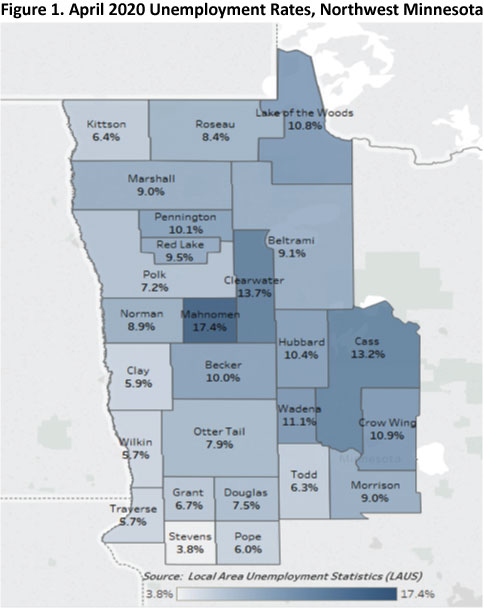
The heterogeneity of the region becomes even more noticeable with the latest unemployment rates for April. For example, Northwest Minnesota is home to the highest unemployment rate in the state at 17.4 percent for Mahnomen County but also has Steven's County 3.8 percent unemployment rate too. The closing of the casino in Mahnomen County had a major impact on unemployment rates whereas counties that are more agriculture dependent saw a less drastic impact on the local economy as compared to those with stronger concentrations of food service and retail, industries that were forced to shut down or drastically change operations. Other counties that saw unemployment rates rise above 10 percent include: Cass, Clearwater, Crow Wing, Hubbard, Lake of the Woods, Pennington, and Wadena (Figure 1).
Unemployment rates are one way to track the impacts of COVID-19 on the regional economy, but in response to COVID-19, DEED began tracking unemployment insurance claims of new applicants and re-activations and collecting demographic and industry information for these applicants. This information gives context on who has been initially impacted by the economic response to COVID-19 and can be used by policymakers to determine what additional responses are needed in the region.
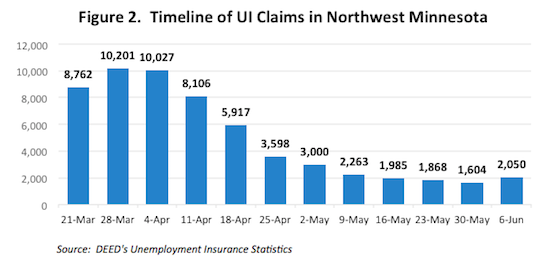
The region, like the state and nation, experienced a sharp increase of unemployment insurance claims at the end of March and beginning of April as over 10,000 people applied in the area. Since the initial layoffs, the number of UI claims has dropped every week until the week of June 6 when claims jumped to 2,050 from 1,604, a 27.8 percent increase. The timeline going forward will be an important indicator of the economy as UI claims either increase or decrease. An increase in the future would suggest that the economy is struggling with returning laid off workers to their job, suggested long-term effects of the initial response to the pandemic or even delayed impacts as industries struggle to maintain similar demand for products and services (Figure 2).
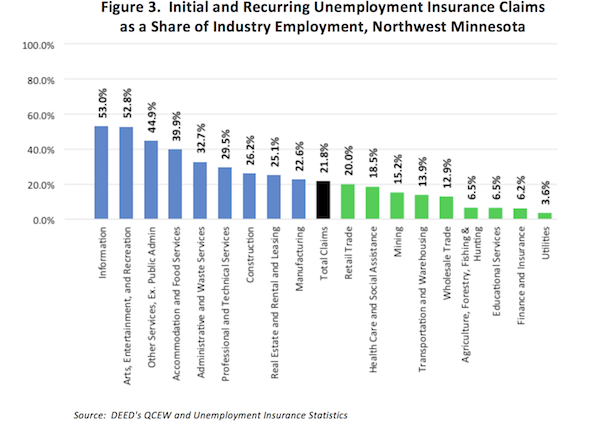
The timing of the UI claims is important but so is the industry from which the claim came, and one way of determining impact to an industry is to measure the UI claims submitted to the total employment within the sector. The most impacted sector was Information, where 53 percent of its total employment in the region filed for unemployment insurance. Arts, Entertainment, and Recreation also had over 50 percent of employment laid off at one point during the pandemic, and another industry that was hit hard was that of Other Services which include personal care services like fitness instructors, childcare workers, and barbers and hair stylists.
At the other end of the spectrum, we have industries that were least affected by responses to COVID-19. For example, only 3.6 percent of total employment in the Utilities industry signed up for unemployment insurance, and the following industries had less than 10 percent of its employment laid off: Finance and Insurance, Educational Services, and Agriculture, Forestry, Fishing, and Hunting. Not every industry was impacted greatly by the initial response to the pandemic, but overall 21.8 percent of all employment in the region had UI claims represent it (Figure 3).
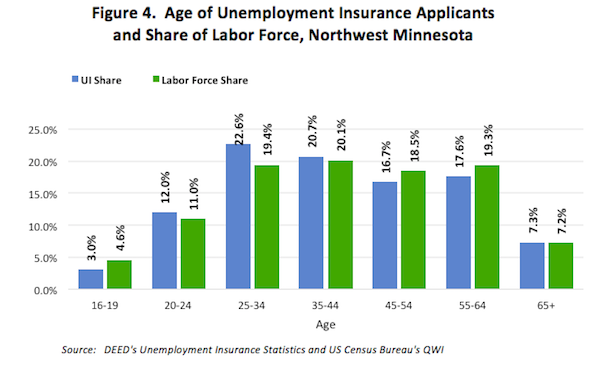
By analyzing the initial and recurring unemployment insurance claims, it becomes evident that younger people have been disproportionally impacted by COVID-19. Twelve percent of all claims came from those 20-24 years old despite only representing 11 percent of the total share of labor force. The difference is even bigger for the next age cohort or those 25 to 34 years old as 22.6 percent of all unemployment insurance claims came from this age cohort while only 19.4 percent of all jobs in the region did. Older age cohorts have a lesser share of unemployment insurance claims than they make up as a share of the labor force. It should be noted that the youngest workers had this relationship, too (Figure 4).
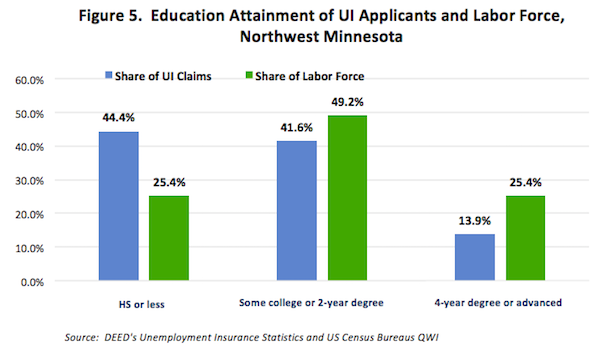
When it comes to educational attainment, people with a high school diploma or less make up nearly 45 percent of all unemployment insurance claims in the region despite representing only 25.4 percent of the total labor force. It also seems that people with higher education attainment have been insulated by the initial impact of COVID-19 as only 13.9 percent of unemployment insurance claims come from those with a four year degree or higher although this cohort makes up 25.4 percent of the labor force (Figure 5).
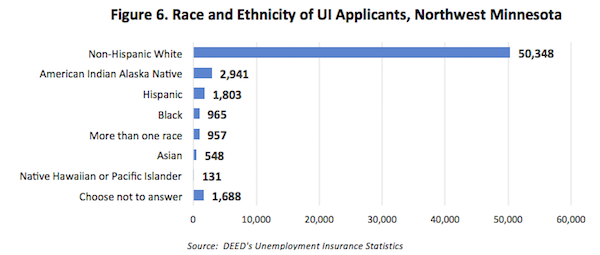
Lastly, DEED is collecting race and ethnicity information for unemployment insurance applicants and about 85 percent of applicants are Non-Hispanic Whites in Northwest Minnesota. However, there were 2,941 applicants that reported American Indian or Alaska Native or about 5 percent of the total claims in the region. American Indians only make up 3.3 percent of the labor force in the region and indicates a group of people who have faced greater economic impacts from COVID-19. There were also 1,803 applicants from those who reported their ethnicity as Hispanic and about 1,000 claims for Black or African American and Two or More Races.
Monitoring the industries and people impacted by the economic shock of the Coronavirus is important from a recovery standpoint. While not all areas of Northwest Minnesota were greatly impacted by the initial response, those younger and with less education were much more likely to be laid off and should be considered when workforce development polices are pursued in response to the pandemic.