Luke Greiner and Mark Schultz
March 2022
Southwest Minnesota has made steady progress regaining jobs lost during the pandemic recession but has not fully recovered and is stuck in the middle in comparison to other planning regions in the state. By the third quarter of 2021, the region was still down 4.4% from the third quarter of 2019, which was similar to Minnesota, down 4.2%, but behind neighboring regions Northwest (-1.4%), Southeast (-3.4%), and Central (-3.5%).
It's impossible to know how this recovery will pan out for Southwest Minnesota, but looking back, data show that it took the region roughly a decade to regain the 6,500 jobs lost from 2008 to 2009 during the Great Recession. While the pandemic recession was just two months long, Southwest Minnesota shed over 10,500 jobs from 2019 to 2020, a greater loss in a shorter time. The rebound so far in 2021 has gained back more than 2,700 jobs, leaving the region slightly worse off than it was in 2009 in terms of jobs needed to get back to the pre-recession level.
Southwest Minnesota is not alone in the recovery. The widespread impact of the COVID-19 pandemic, the vast shift to remote work, and a surging number of job vacancies means that competition for labor is broad and fierce. Companies that were able to sidestep layoffs in 2020 are better positioned today, while others that were more impacted by the pandemic recession and aftermath are in more challenging positions with a larger number of jobs to regain amidst a tight labor market (see Figure 1).
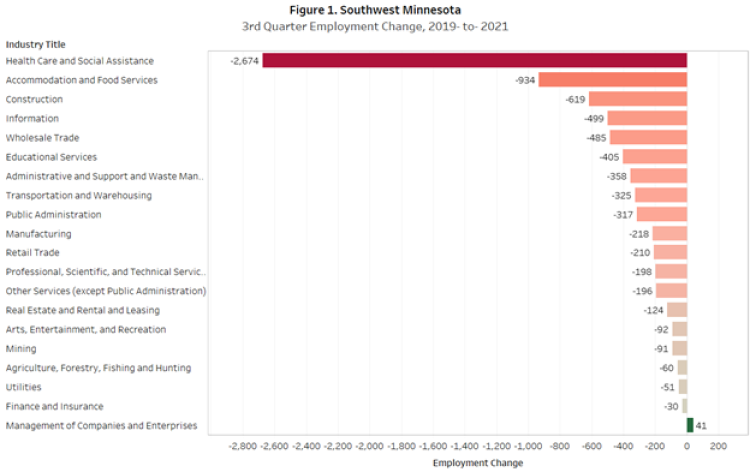
Using a point in time reference, as Figure 1 does, is helpful to know the current situation, but using historical trends allows a better understanding of how we got there. This article provides historical trends of third quarter employment levels1 for each major industry in Southwest Minnesota.
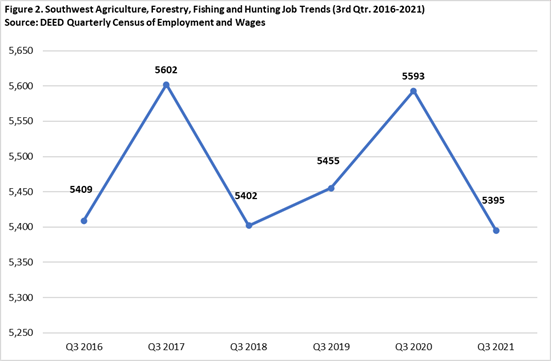
Agriculture, Forestry, Fishing, and Hunting saw its fair share of ups and downs over the last five years. This sector saw a large increase from the third quarter of 2016 (193 jobs or 3.6%) by reaching a peak of 5,602 jobs in the third quarter of 2017. This was followed by a slump the following year when it lost 200 jobs. The next two years again brought job gains. This industry was one of only three that saw job gains after the onset of the pandemic with a bump of 138 jobs or up 2.5% from 2019 to 2020. This was followed by a large decline from the third quarter of 2020 to the third quarter of 2021 (198 jobs or 3.5%). Despite those swings, during this five year stretch of time the number of jobs in this industry sector saw a decline of only 14 jobs for a drop of 0.3% (see Figure 2).
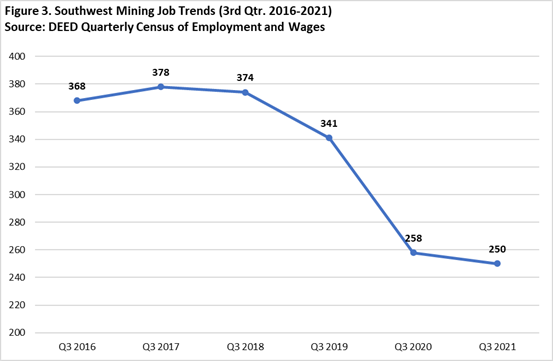
Mining began to see a decline in the number of jobs prior to the pandemic, peaking at 378 jobs in the third quarter of 2017. Since then it's been all downhill. The largest annual numeric loss, however, was seen between the third quarters of 2019 to 2020, coinciding with the initial pandemic hit on the region's jobs. During this one-year period the region lost 83 Mining jobs for a drop of 24.3%. This was the largest proportional loss in jobs seen among the 20 industry sectors. Overall, over the last five years this industry sector dropped by 118 jobs or 32.1%, which was the largest proportional drop of all sectors (see Figure 3).
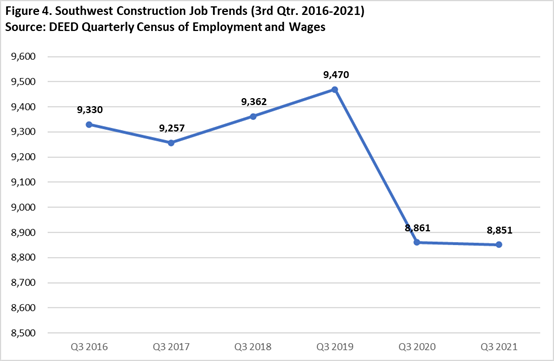
Construction was coming off a two-year increase in jobs when the pandemic hit, increasing by 213 jobs for a bump of 2.3% from the third quarter of 2017 to the third quarter of 2019. The following year, after COVID struck Southwest Minnesota's labor market, the Construction industry sector saw a decline of 609 jobs for a loss of 6.4%. The job loss continued into the next year with the region losing an additional 10 jobs or 0.1%. Overall, during the last five years the number of Construction jobs has declined by 479 for a drop of 5.1% (see Figure 4).
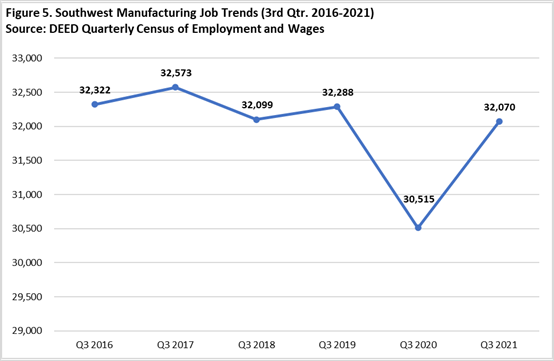
Manufacturing, which makes up the largest number of jobs in the region, had job counts that were rather stable prior to the pandemic. From the third quarter of 2016 to the third quarter of 2019, the region lost just 34 Manufacturing jobs, a drop of 0.1%. The big loss in jobs came after the pandemic hit where the region lost 1,773 Manufacturing jobs from the third quarter of 2019 to the third quarter of 2020, a decline of 5.5%, the third highest numeric loss of all the industry sectors during this timeframe. The Manufacturing industry sector in the region bounced back the following year after gaining back 1,555 jobs for an increase of 5.1%, not quite reaching pre-pandemic levels. Overall, over the last five years Manufacturing has dropped 252 jobs for a loss of 0.8% (see Figure 5).
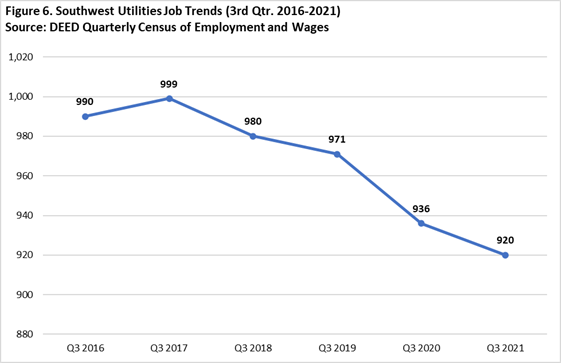
Utilities has seen a rather steady decline in jobs over the years after peaking at 999 jobs in the third quarter of 2017. While that was a small bump above the job count the previous year, this industry sector has seen consistent declines in the four years following. From the third quarter of 2017 to the third quarter of 2021 the Southwest region saw a decrease of 79 Utilities jobs, equaling a drop of 7.9%. Overall, over the five-year period spanning the third quarters of 2016 to 2021, the total loss of Utilities jobs equaled 70 for a dip of 7.1% (see Figure 6).
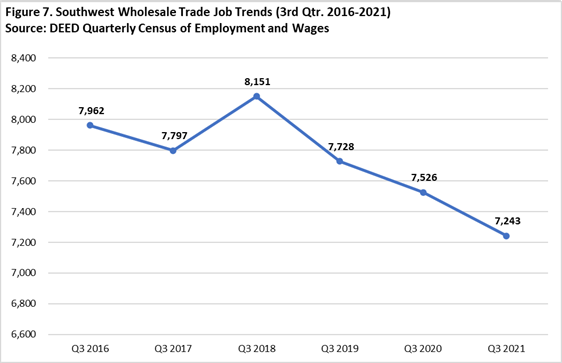
Wholesale Trade in general has seen a decline in jobs over the last five years, dropping 719 jobs for a fall of 9.0% from the third quarter of 2016 to the third quarter of 2021. The only point in time that this industry sector saw an increase was from the third quarter of 2017 to the third quarter of 2018 when it increased by 354 jobs or 4.5%, peaking at 8,151 jobs in 2018. Since then the drop in jobs has been consistent in the years to follow, falling by 908 jobs or 11.1% from the 2018 peak to the third quarter 2021 (see Figure 7).
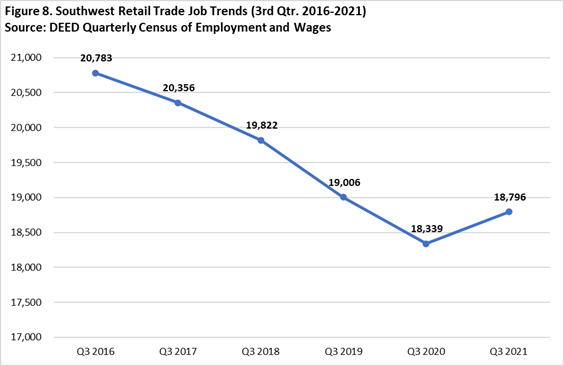
Retail Trade was experiencing consistent job losses over the past five years, even before the pandemic hit. This industry sector saw 20,783 jobs in the Southwest region in the third quarter of 2016 and that had dropped to 19,006 jobs in the third quarter of 2019. After the pandemic hit in 2020, there was a more rapid loss of 667 jobs (3.5%). However, in the following year the Retail Trade sector saw an increase in jobs to the tune of 457 additional jobs for a bump of 2.5%. Overall, over the last five years Retail Trade has lost almost 2,000 jobs for a drop of 9.6% (see Figure 8). This was the largest numeric drop among all 20 industry sectors over the last five years.
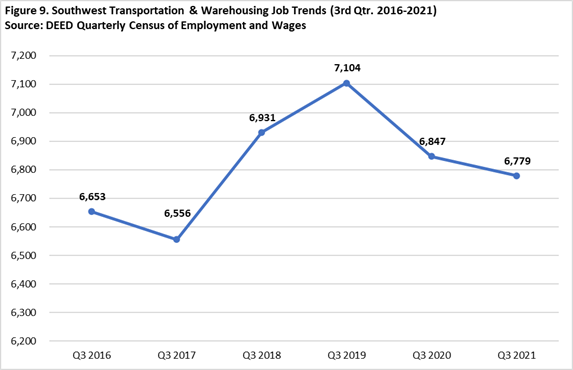
Transportation and Warehousing started the last five-year period with a job decline, dropping almost 100 jobs from the third quarter of 2016 to the third quarter of 2017. However, the region picked up jobs the following two years with an increase of 548 jobs or 8.4%. After the pandemic hit, job declines ensued with a fall of 257 Transportation and Warehousing jobs or 3.6%. The next year followed with additional job loss, although to a smaller degree, down just 68 jobs. Over the last five years this industry was one of two industry sectors that gained jobs, adding 126 jobs, the largest numeric increase, for an increase of 1.9% (see Figure 9).
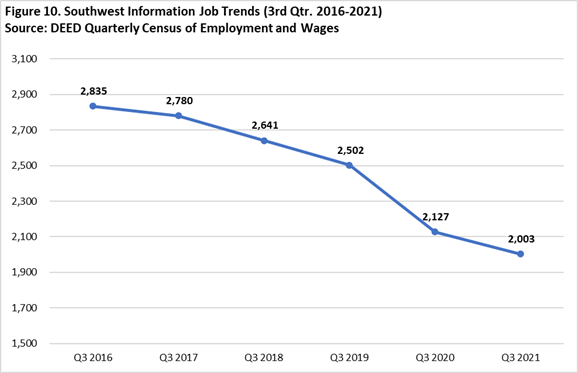
Information has been plagued with job loss over the last five years according to third quarter job counts from 2016 to 2021. As the years have passed, this industry sector lost anywhere between 55 (2016-2017) and 375 (2019-2020) jobs each year. Over the last half decade the Information industry sector in Southwest Minnesota has experienced a decline of 832 jobs for a fall of 29.3% (see Figure 10). This was the second highest percentage decline among all 20 industry sectors.
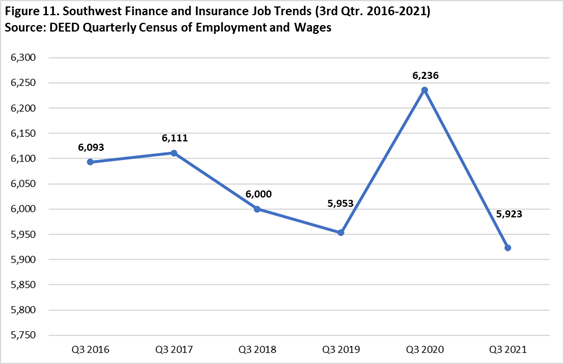
Finance and Insurance was one of the few industry sectors that saw an increase in jobs after the pandemic hit in 2020. Despite seeing overall job loss from the third quarter of 2016 to the third quarter of 2019, a drop of 140 jobs or -2.3%, this sector bounced back the following year with a gain of 283 jobs or +4.8%. This was the largest real and proportional growth seen among the three sectors that saw increases during this year-long time frame. Unfortunately, the next year saw all those jobs gone and then some with a decline of 313 jobs (-5.0%), leaving this sector with fewer jobs than was seen at pre-pandemic levels. Over the last five years this sector has lost 170 jobs or 2.8% (see Figure 11).
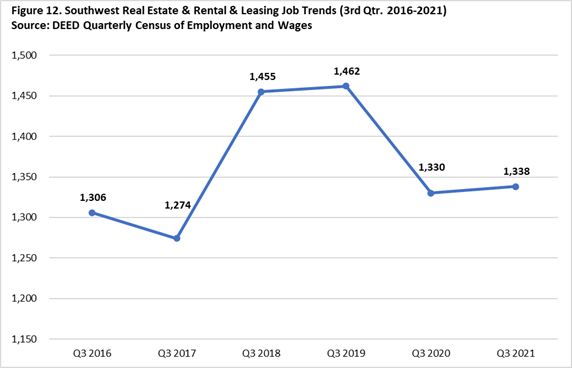
Real Estate and Rental and Leasing saw a slight increase in jobs from the third quarter of 2016 to the third quarter of 2021, increasing by 32 jobs or 2.5%. This industry saw a hefty increase from the third quarter of 2017 to the third quarter of 2018 with a jump of 181 jobs (14.2%) after losing jobs the previous year. After the pandemic took hold, the industry again lost jobs to the tune of 132 fewer jobs (9%) from the third quarter of 2019 to 2020, and recovery has been slow as the region gained only 8 jobs the following year. Overall, this industry sector has gained 32 jobs over the last five years, making it the second of only two sectors to see job gains. This equaled a 2.5% gain which was the highest proportional gain of the two (see Figure 12).
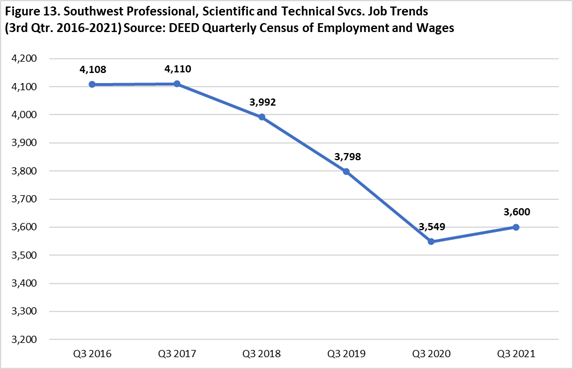
Professional, Scientific, and Technical Services saw a very mild increase in jobs from the third quarter of 2016 to 2017, after which the industry experienced consistent job declines over the next three years. From the third quarter of 2017 to the third quarter of 2020 this industry sector saw a drop of 561 jobs or 13.7%, with the most significant drop occurring during the pandemic (249 jobs or 6.6% from 2019-2020). Since then, the industry has recovered slightly with an increase of 51 jobs or up 1.4%. This industry shed 508 jobs from 2016 to 2021 for a decline of 12.4% - the third largest proportional decrease among the 20 industry sectors (see Figure 13).
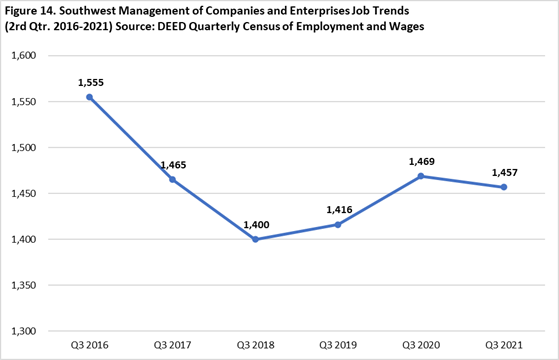
Management of Companies experienced a downslide from the third quarter of 2016 to the third quarter of 2018, dropping by 155 jobs or 10%. The following two years brought about an increase in jobs, but not enough to overcome the loss the three years prior, increasing by 69 jobs or 4.9%, including an actual increase of 53 jobs (3.7%) after the pandemic hit the region. The following year, however, the job decline continued. Overall, this industry sector lost almost 100 jobs (6.3%) over the last five years (see Figure 14).
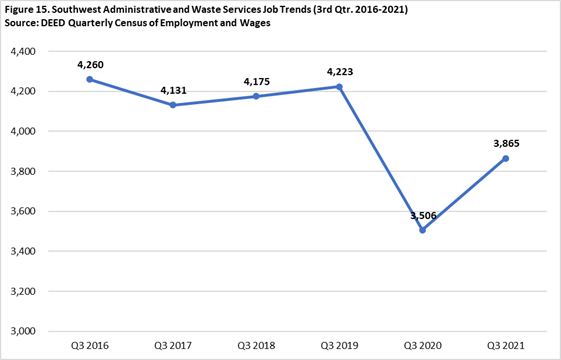
Administrative Support and Waste Management Services jobs remained pretty stable from the third quarter of 2016 to the third quarter of 2019, fluctuating between 4,131 jobs (2017) and 4,260 jobs (2016) during this time frame. The last two years is where the bulk of the action was with the sector losing 717 jobs (17.0%) after the pandemic hit, the second largest proportional loss among all the industry sectors, then gaining back 359 jobs (10.2%) the following year. Overall, this industry sector lost almost 400 jobs for a decline of 9.3% over the last five years (see Figure 15).
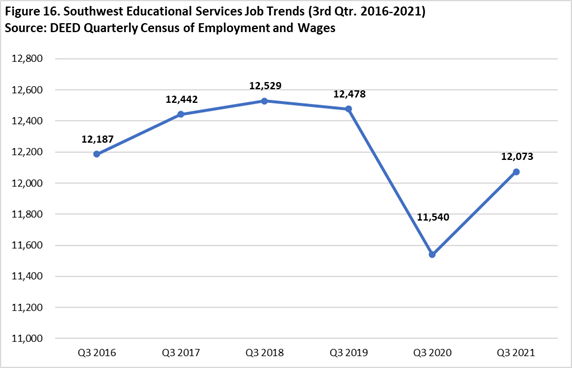
Educational Services was experiencing job gains from the third quarter of 2016 to the third quarter of 2018, increasing by 342 jobs or 2.8%. A slight decline of 51 fewer jobs occurred the following year; however, the big blast occurred after the pandemic hit when this industry sector lost almost 940 jobs for a drop of 7.5% from the third quarter of 2019 to the third quarter of 2020. This sector has rebounded some by gaining back 533 jobs for a bump of 4.6% the following year. Overall, Educational Services lost 114 jobs (0.9%) over the last half decade (see Figure 16).
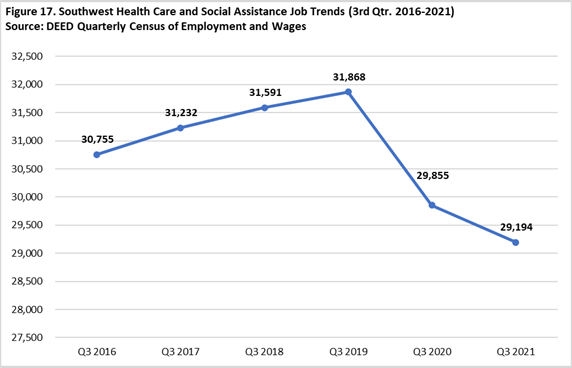
Health Care and Social Assistance, which accounts for the second highest number of jobs in the region, was enjoying steady increases in jobs from the third quarter of 2016 to the third quarter of 2019, increasing by over 1,100 jobs of 3.6% over that three-year period. Then the pandemic hit, and the industry sector saw a large drop in jobs equaling over 2,000 fewer jobs for a decline of 6.3% from 2019 to 2020 and bringing the number of jobs to below pre-pandemic levels. This was also the largest numeric decrease among all the industry sectors during this one-year timeframe. Job loss continued the following year as the region lost an additional 661 jobs. Overall, Health Care and Social Assistance dropped by 1,561 jobs or 5.1% during the last five years (see Figure 17). This was the second largest numeric drop in jobs during this five-year period.
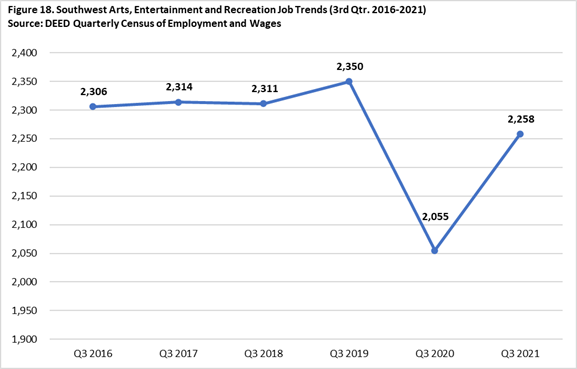
Arts, Entertainment, and Recreation was holding steady from the third quarter of 2016 to the third quarter of 2019, seeing job counts ranging from 2,306 (2016) to 2,350 (2019). That is, until the region was shaken by the pandemic, which resulted in the loss of almost 300 jobs in this industry sector, a decline of 12.6%. While the following year brought about some recovery with an increase of 203 jobs or 9.9%, the numbers still did not equal what was seen pre-pandemic. Overall, from the third quarter of 2016 to 2021 the region lost just under 50 jobs for a drop of 2.1% (see Figure 18).
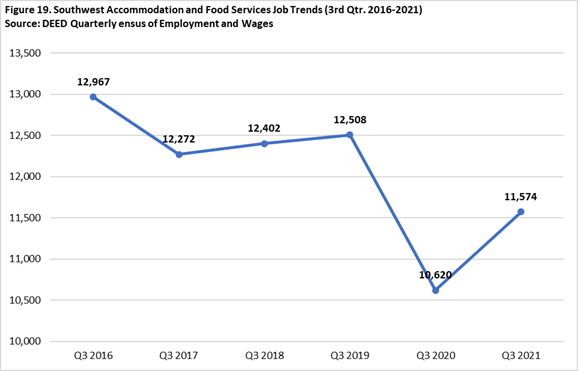
Accommodation and Food Services saw almost 13,000 jobs in the third quarter of 2016, and by the third quarter of 2019 that number had dropped to 12,508, equaling a decline of almost 460 jobs or 3.5%. Like many of the other industry sectors, this sector experienced job loss when the pandemic hit, losing 1,888 jobs for a drop of 15.1% from the third quarter of 2019 to 2020, which was the second highest numeric and third highest proportional drop in jobs among all industry sectors from 2019 to 2020. This sector also recovered some jobs the following year, seeing an increase of over 950 jobs or a bump of 9%. Overall, this sector saw a decline over the last five years equaling 1,393 fewer jobs or 10.7% (see Figure 19), which was the third largest numeric drop in jobs of all 20 industry sectors during this time.
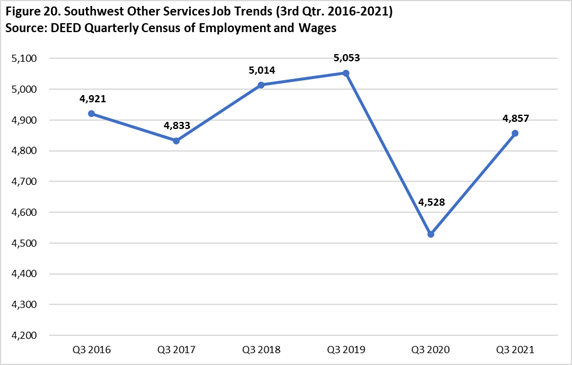
Other Services experienced a few ups and downs over the last five years, starting with a decrease in jobs from the third quarter of 2016 to 2017, down 88 jobs or 1.8%. This was followed by two years of job growth culminating in a peak of 5,053 jobs in the third quarter of 2019, after growing by 220 jobs or 4.6%. After the pandemic hit the region, this industry sector saw a decline of 10.4% or a loss of 525 jobs. However, this sector recovered some of those lost jobs the following year, jumping by 329 jobs or 7.3%. Other Services saw a loss of jobs over the last five years to the tune of 64 fewer jobs or 1.3% (see Figure 20).
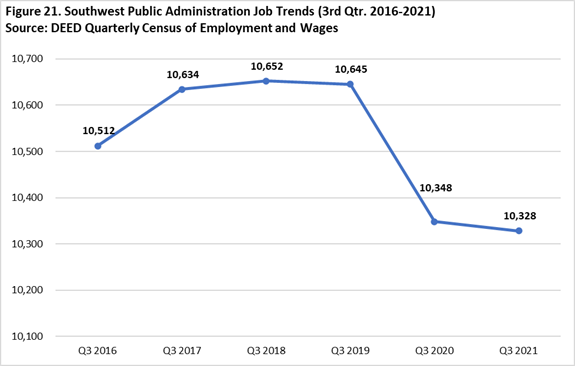
Public Administration saw a couple of years of job increases between the third quarter of 2016 to the third quarter of 2018 before seeing three years of decline. In those first two years the industry sector saw a jump of 140 jobs or 1.3%. The following year (2018 to 2019) brought about a small decline of 7 jobs while the next year (2019 to 2020) is where the industry was hit the hardest, shedding almost 300 jobs for a drop of 2.8%. The job decline continued from 2020 to 2021, but not as drastic as the year before as the sector lost 20 additional jobs. The third quarter job counts from 2016 to 2021 show that Public Administration saw an overall decline of 184 jobs or 1.8% (see Figure 21).
The previous charts illustrate how varied the economic impacts of the pandemic have been across different industries in the Southwest/South Central area. Some industries suffered massive losses but quickly began to rebound (Other Services, Arts, Entertainment, and Recreation, Manufacturing). Others that seem to have been in a steady decline before the pandemic simply continued to decline (Information, Wholesale Trade, Utilities, Mining), while others that had been growing (Health Care and Social Assistance, Public Administration, and Transportation) suffered large losses and have not experienced a rebound in 2021.
The current conditions give workers choices between returning to their previous line of work, looking for something new and different, or choosing to retire or stay at home to care to family. A job in a brand new field may be the most exciting but that does not mean that changing jobs is simple, quick, or easy. Despite having record numbers of job openings, employers still need to hire competent workers who can successfully complete their job. Workers looking to make a job change might need training to meet the needs of employers. The Department of Employment and Economic Development can help you decide.
1Third quarter data are used because they are the most recent quarter of available data for 2021.