by Anthony Schaffhauser
September 2022
We have seen a lot of labor market records broken over the past two-and-a-half years, with many recent statistics documenting the hottest labor market of all time. Minnesota's recovery has been exceptionally adept at lowering unemployment, producing not only the lowest unemployment rate in our state's history, but also in the nation.
Hot labor markets typically increase labor force participation, and we are starting to see this again in Minnesota. However, labor force participation is not immediately roaring back to pre-pandemic levels, which seems strange. Is it just a matter of time for early retirements and workforce adjustments to settle out, bringing us to where we would have been without the pandemic? Or are we seeing an enduring change?
The labor force participation rate (LFPR) is the share of the civilian, non-institutionalized population that is either working or actively seeking work, or more specifically, employed or unemployed. Labor force participation dropped precipitously with the pandemic but had been generally declining slowly since its peak in 2000 nationally and in 2001 for Minnesota. Slightly over half of the LFPR drop nationally from 2000 to 2020 – the high point to the low point – is attributable to demographics such as age, sex, and education.1 The decline from the peak in early years was due to lower labor force participation within some demographic groups, but an aging population started to suppress the LFPR around 2005, and later had a substantial impact on the LFPR.2 The Great Recession's aftermath pulled the LFPR down further.
The massive Baby Boomer population cohort started to turn 65 in 2011, and the youngest Boomers will reach 65 in 2029. So, the aging population will continue to pull down the LFPR over the next two decades. Even though the LFPR within every age group 55 years and over has been increasing over time, the aging population still brings down the overall LFPR. This is because LFPR is drastically lower in the 65 to 74 and 75 and older age groups, and as the Boomers age the older age groups are growing the fastest. Last year the oldest Boomers started to turn 75.
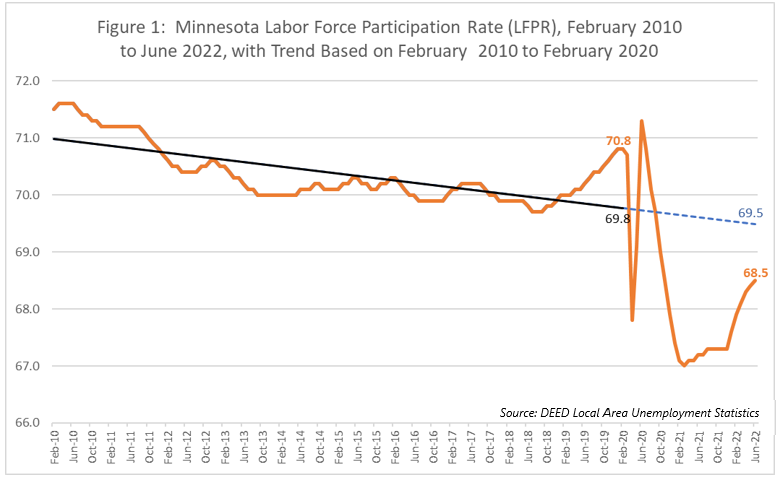
The economy also has an impact. In October 2013, Minnesota's LFPR had started to flatten, then in July of 2018 it started to increase due to eight years of job growth. Following a sluggish rebound coming out of the Great Recession, the labor market had finally heated up, bringing more participants in to fill the increasing number of job vacancies. The increase continued until the pandemic hit in March 2020 (see Figure 1).

Foreign-born workers also contributed to this LFPR turnaround. In fact, Minnesota's labor force growth would have been less than half of what it was between 2010 and 2020 without foreign-born workers3: foreign-born workers' LFPR was 72.7% versus 69.1% for native born.
Figure 1 shows the Minnesota LFPR, along with a simple best-fit trendline through February 2020. The trendline smooths out the ups and downs to give us an impression of what is "normal" given the variation in data points. It shows that from 2012 to 2018, LFPR was running below trend as the aftermath of the Great Recession played out. Then it reached well above trend by 2020 encouraged by economic growth.
The trendline is continued as a dashed line to June 2022 to depict where we would expect LFPR to be if it were not for the pandemic. That dashed line is based on what was observed as of February 2020, regardless of the LFPR data for March 2020 to June 2022, showing the trend to June 2022 as if the pandemic had not happened. The reason to look at this trend is to see how much the pandemic changed the prevailing course of the LFPR and provide a marker of what getting back to normal would mean.
It is worth noting that where the trendline starts is consequential. A trendline from the peak LFPR in 2001 would reflect the drop from the peak to the trough and end much lower by early 2020. The current June 2022 LFPR is above a 2001-2020 trendline. While this lower trend could turn out to be the case, at this point it would show the LFPR increase from 2018 to 2020 as an extensive deviation, and the current LFPR as normal. However, it does not feel normal.
In contrast, a trendline that starts in July 2018 would show the increase in LFPR to 2020 as normal, but it occurred along with a period of exceptional economic growth. A 2010 start point is between the drop from the peak 2001 LFPR and the 2018 start of a LFPR increase. It is also between the end (trough) of the Great Recession (June 2009) and when Boomers started to turn 65 (2011). Besides being a round number, it also balances economic and demographic factors at play.
Following the 2010 trendline we would have expected the LFPR to be 69.5% in June 2022 without the pandemic. We are a full percentage point below trend. Notably, this is the same amount below trend as it was above trend in January and February of 2020. If we were to exceed the trend by as much as February 2020 exceeded the trend, we would be at 70.5%.
Are enough workers going to enter the labor force to bring us to trend or even above? The labor market appears to be hot enough to make that plausible.
Comparing Minnesota Job Vacancy Survey results for fourth quarter 2021 to fourth quarter 2019, there were 1.7 times more job vacancies, and the highest number of vacancies ever recorded. The job vacancy rate in 2021 was 8.2% (which is also the highest ever recorded) versus 4.6% in 2019, and there were a mere 0.3 job seekers per vacancy versus 0.8 in 2019.
At 1.8%, the June and July 2022 unemployment rate is the lowest ever recorded in Minnesota and the lowest in any state. It is substantially lower than Minnesota's lowest 2019 point of 3.3% for April through July. Second quarter 2022 also saw the lowest number of unemployed Minnesotans ever, until dropping even more in July 2022 to 55,502.
Workers call it "hot"; employers call it "tight." The fact that Minnesota has the lowest unemployment rate suggests that Minnesota employers are squeezed the most. From the employer perspective, job openings dictate how many jobs need to be filled, whether from job growth or turnover. The Job Openings and Labor Turnover Survey (JOLTS) enables state comparisons of labor market conditions. (All cited JOLTS statistics are for June 2022.)
A higher job openings rate indicates a tighter labor market.4 Minnesota's openings rate is 6.9%, higher than the U.S. at 6.6%, and higher than 27 states and the District of Columbia. So, by this measure Minnesota's labor market is tight by comparison, but closer to the middle of the pack than to the tightest.
A more telling measure is the ratio of openings to hires. This is an indicator of a labor market's speed to fill openings. If one looks at the openings as a monthly inventory of jobs to fill, dividing by the monthly hires tells us how many months it would take on average to fill the jobs. Minnesota's openings to hires ratio is 2.16, compared to 1.68 for the U.S. That is, it takes on average a little over two months for Minnesota employers to fill positions compared to less than two months nationwide. This is the second highest (longest) in the nation, above Kansas (2.02), Vermont (2.08) and Wisconsin (2.10), but below Massachusetts (2.35).
A final JOLTS measure to consider is quits. A high number of workers quitting jobs is a strong indicator of labor market tightness because workers are more likely to voluntarily leave a job if they have another offer or expect another job is available. The JOLTS quits rate does not include retirements. Minnesota's quits rate is 2.3%, lower than the 2.8% quits rate for the U.S. and is tied for the 5th lowest quits rate in the U.S. with California, New Jersey, and Wisconsin. This indicates that Minnesota employers had to scramble less than those in most states to fill jobs that employees quit. That is good news in such a tight labor market.
By comparison to before the pandemic and to other states, Minnesota's labor market is extremely hot (or tight). Data shows that the labor market is hotter now than in 2019 by multiple measures, yet the LFPR remains below the pre-pandemic trend. Why hasn't this hottest ever labor market in Minnesota boosted the LFPR more? Keep in mind that 2020 brought the opposite labor market records. The Minnesota unemployment rate hit an all-time-record high of 10.8% in May, following the U.S. all-time-record of 14.7% in April. Minnesota's previous record was 8.9% in December 1982 to January 1983. The magnitude and speed of the LFPR drop in 2020 was also unprecedented.
Minnesota shed -197,435 jobs, or -6.8%, in one year as a result of the pandemic recession compared to the loss of -125,015 jobs, or -4.7% in three years during the Great Recession. Jobs lost in the Great Recession were regained by 2013, yet it took five more years adding roughly 38,000 jobs per year for the LFPR to make a sustained increase after 2018, and it is worth noting that LFPR gains happened later in Minnesota than the U.S.
How much faster can we expect Labor Force Participation (LFP) to respond in the hot labor market of this recovery? We are handily beating the pace of jobs recovery of the Great Recession, adding back 55,721 jobs between 2020 and 2021. Clearly a lack of available jobs is not an issue like it was in the recovery from the Great Recession. The LFPR started to vault higher in the first six months of 2022, so it may be a relatively short time before it comes back to trend or higher, but it is not instant. Pandemic supply chain issues are still being worked out, and analogously workers may need time to be re-engaged in the labor force.
One important difference from past recessions is the impact of the pandemic recession on the availability of childcare, as well as caregiving for seniors and other vulnerable adults. This pulled workers out of the labor force as the supply of these services dropped. Note that employment in both Nursing & Residential Care Facilities and Child Day Care Services each dropped -8.3% from first quarter 2020 to first quarter 2022, leaving more caregiving to families.
Another difference is the health impact of long COVID preventing people from returning to work or forcing them to return at reduced hours. The estimated impact is a loss of three million full-time equivalent workers nationally or 1.8% of the entire U.S. labor force5.
Changes in immigration policies and trends have also delayed LFP gains.6 If Minnesota follows the U.S., the LFPR for foreign-born workers will soon rebound to pre-pandemic levels. Foreign-born workers were 18.5% of the U.S. labor force in February 2020 and dropped to a low of 17.6% by June 2020. Foreign-born employment dropped proportionately more and for more months than native-born. This decline in foreign-born employment follows the same timeline as the pandemic decline in immigration. Nonetheless, the foreign-born labor force recovered to 18.7% by December 2021.7
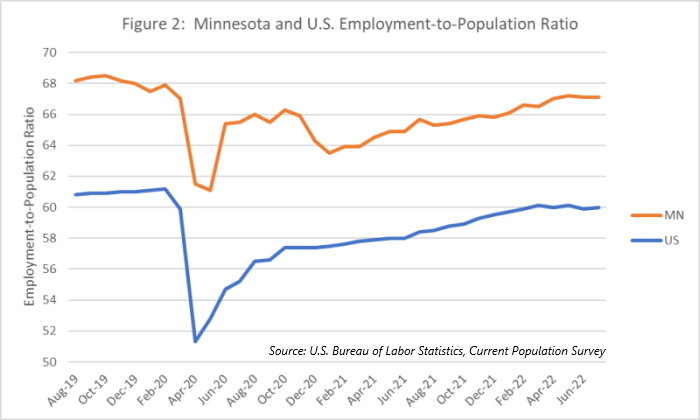
It seems reasonable to assume that foreign-born workers will also continue to return to work in Minnesota, but it is taking longer. This is because Minnesota experienced a delayed recovery in overall LFP compared to the U.S. due to a second COVID-related dip in Minnesota in the winter of 2020-2021 (see Figure 2).

The pandemic accelerated the rate of retirement.8 This implies that people retired earlier than they would have otherwise. If this is true, the impact on the LFP trend is temporary because retirements have simply been pulled forward in time.9 For example, the impact of retiring two years early in the summer of 2020 has already passed. However, the impact of increased retirement is having longer-lasting effects because retirement is not always permanent.
Research examining the U.S. Current Population Survey (CPS) microdata shows that the pandemic increase in retirement was not as much from an increase in people moving from employment to retirement as it was from a decrease in retired people becoming re-employed.10 The researchers determined that even if retirement to employment returned to pre-pandemic rates, it would take over two years for the share of retired to drop to its pre-pandemic level. As of April 2022, the retirement-to-employment rate had been increasing but was not as high as in 2018-2019 (the authors share their data).
Although the long-term trend in overall LFP is down, it has been flattened over the past two decades by increased LFP of older cohorts. The pre-pandemic trend incorporates increased LFP by the 55 years and older cohorts, so the actual future trend will be lower without them. However, countering the impact of increased pandemic retirements is not a matter of just waiting out early retirements. Retirees would also need to re-enter the workforce at prior rates to restore LFP of these age cohorts and even then, it will take time. So, this is another factor preventing or slowing increased LFP, and it is of greater importance in states like Minnesota with a relatively large share of the population aged 55 and older.
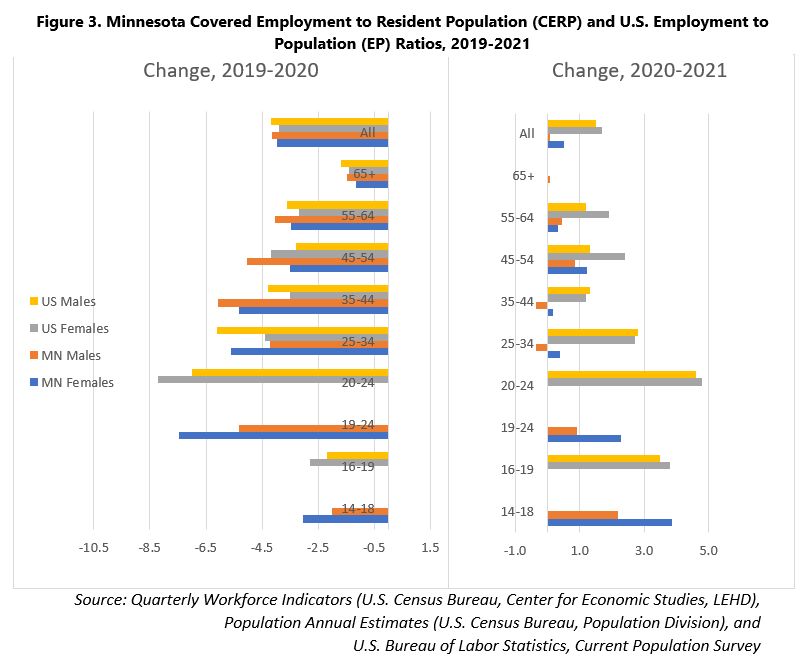
A deep dive into state and national data sets on employment to population ratios shows that early retirement and a slowed pace of unretirement remain important factors but were not the main drivers of below-trend LFP as of 2021. Figure 3 uses state-level Quarterly Workforce Indicators (QWI) employment data by age and sex, derived with state Unemployment Insurance wage records, divided by Minnesota's resident population. We call it the "Covered-Employment-to-Resident-Population (CERP)" ratio. The U.S. employment-to-population (EP) ratio data is from the CPS and uses the civilian non-institutionalized population.11 While CERP and EP are not directly comparable, comparing the change in these measures is useful.
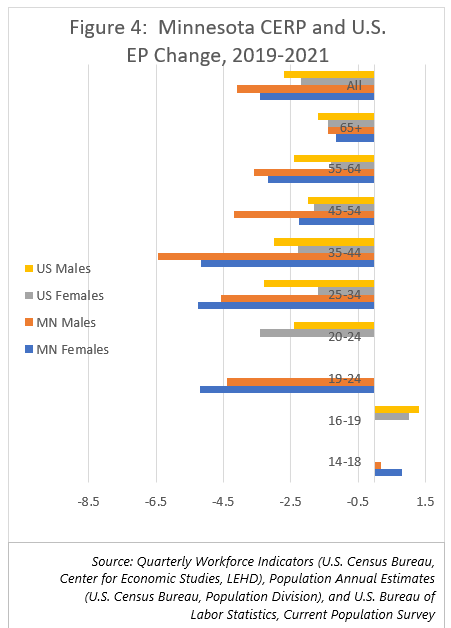
The drop in MN CERP and U.S. EP from 2019 to 2020 is average or less than average for ages 55 to 64 and well below average for 65 years and older, reflecting the financial imperative for many to work past age 65. From 2020 to 2021, CERP/EP for 55 to 64 year old's increased and held steady for 65 years plus. Over the two-year period, CERP/EP declined less than average for 55 to 64 year old's and significantly less than average for 65 years and older (see Figure 4).
Like the eldest, the youngest age groups also had well below average declines in CERP/EP from 2019 to 2020 (the state QWI uses ages 14-18, whereas the CPS uses 16-19). Then, with the largest increases in 2021, teenagers were the only age group with a net gain from 2019 to 2021. The fact that these workers face the lowest health risk from COVID, along with increased wages for entry-level jobs, countered the long-term trend of declining youth LFP. This over-two-decade trend is attributed to a greater emphasis on school over work. While the numbers of working youth remain small compared to other age groups, this is where the hot labor market countered a demographic trend.
The greater than average declines were among those aged 20 to 34 years for the U.S. and 19 to 44 years for Minnesota. U.S. females aged 25 to 34 and Minnesota females aged 35 to 44 had lesser declines than males. The U.S. saw a spring back in 2021 for these age groups, bringing U.S. two-year EP declines from 2019 to 2021 more in line with the overall averages for all females and all males. Nearly all subgroups in Minnesota did not spring back in 2021 as much as in the U.S., and those aged 19 to 44 had the largest difference from the U.S. (see Figure 3).

The difference between Minnesota and the U.S. seen in the 2020 to 2021 changes of Figure 3 is explained by the dip in Minnesota EP in 2021 seen on Figure 2. Minnesota then had greater gains than the U.S. in 2022. Minnesota's EP was 65.8% in December 2021 compared to 67.9% in February 2020. Minnesota had regained 96.9% of its February 2020 EP by the end of 2021. The U.S. EP was 59.5% in December 2021 compared to 61.2% EP in February 2020. The U.S. had regained 97.2% of its February 2020 EP by the end of 2021. However, by July 2022, Minnesota had climbed back to a 67.1% EP, 98.8% of its February 2020 level. By comparison, U.S. EP of 60.0% for July 2022 was 98.0% of February 2020.

The lesser 2020 to 2021 gains of Minnesotans aged 19 to 44 compared to the U.S. correspond to Minnesota's 2021 EP dip, which resolved in the first half of 2022. Thus, the first half of 2022 likely saw many Minnesotans aged 19 to 44 returning to work because this is where the declines in CERP were above the Minnesota average, and where the Minnesota change in 2021 did not correspond to the U.S. gains. We will have to await future QWI data releases to confirm the age groups that gained the most in Minnesota in 2022, but Minnesota CERP generally followed the U.S. EP patterns from 2019 to 2020 and reflects the U.S. patterns for the youngest and oldest age groups from 2020 to 2021.
Since the U.S. regained EP sooner, the 2019 to 2021 two-year EP change by age and sex of the U.S. could foreshadow Minnesota's situation in 2022. Note that U.S. females aged 25 to 34 had pulled up to a less-than-average EP decline, and the decline for U.S. females aged 35 to 44 had returned to about average. Also, the U.S. EP decline from 2019 to 2021 remains highest for females aged 20 to 24, followed by males aged 25 to 34 and males 35 to 44. It is reasonable to expect these Minnesota subgroups to have similar changes in the first half of 2022.
The pattern by age and sex suggests that there is more at play than caregiving and retirement through 2021. Females regained more than males both in the U.S. and Minnesota. The fact that U.S. females aged 25 to 34 pulled to a below average decline suggests many families are somehow coping with childcare. Perhaps males are taking on a greater role, keeping them out of the labor force. The below average declines for 55 and older age groups show that retirements are not the main driver of decreased CERP/EP through 2021. However, it remains a significant factor unless we see increases like in the pre-pandemic trend.
Three major takeaways from this age and sex subgroup analysis are:
By early 2020, the LFPR had soared above trend due to an abundance of job opportunities built up over a decade of economic growth, but now we are below trend by the same amount as of July 2022. In that sense, July's LFPR is no more unusual than the level of early 2020. However, it is patently inconsistent with our hottest labor market of all time. Given our current labor market, our base case assumption is that LFP will spring back, but it will take time. And only time will tell.
History tells us that there is potential for LFPR to go higher, and it makes sense that it would take time. The economy leads the labor market, and the labor market leads LFP. Minnesota's pandemic LFP recovery has been a bit slower than the U.S., and we were slower in getting the LFP increases leading up to February 2020 as well. But we eventually caught up with gains, and we are now showing faster gains in the first half of 2022. These gains are likely from Minnesotans aged 19 to 44 rejoining the labor force in 2022 in line with the U.S.
Still, there are factors that suggest neither Minnesota nor the U.S. will return to trend LFP. Caregiving and long COVID have pulled people out of the labor force. We don't know if or when these workers will be able to return. Also, rates of unretirement for the oldest age groups have not returned to pre-pandemic levels nationally.
Labor force participation of the youngest and oldest Minnesotans discovered with the CERP analysis is notable. Youth made gains and seniors aged 65 years and older lost little in terms of employment. The increased LFP of older cohorts is a feature of the long-term trend that has bolstered the labor force up until the pandemic. The fact that our CERP analysis shows a below average decline for those aged 55 and older is encouraging for regaining that LFP trend.
Increased youth LFP, although small, counters the long-term trend of school over work. Yet, LFP increases with education, so gains now could result in declines later. Additionally, lifetime earnings increase with higher education and most of Minnesota's projected high-growth, high pay occupations require higher education. For youth LFP gains to continue, employers may need to make youth jobs more compatible with school, for example with accommodating schedules. To serve working students, schools may need to merge education with work, for example with educational credit for work-based learning.
Overall, we should keep in mind that even if we were to get above the trend LFPR by as much as in early 2020, the LFPR would still end up lower due to demographics. Given that the long-term LFP trend is down, any successful strategies and innovations developed by employers to recruit, onboard, engage and retain workers in this hot labor market should serve them well in the future.
1Commentary: Can a hot but smaller labor market keep making gains in participation?
2Projecting Unemployment and Demographic Trends
4The JOLTS openings rate is job openings divided by the sum of employment plus job openings. Job Openings and Labor Turnover Survey
5New data shows long Covid is keeping as many as 4 million people out of work
6Recovering from Recession: Employment and Labor Force Trends
7Immigrant Employment Patterns during the Pandemic
9Accelerated Retirements May be Playing a Role in the Current Workforce Shortage
10What Has Driven the Recent Increase in Retirements?
11The QWI data are used at the state level because the sampling error for the state-level CPS data is too high for reliable analysis of age and sex subgroups. However, there are no comparable national QWI data. National QWI data are only available for private sector employment, excluding state and local government employment. Also, we cannot make national comparisons with the annual QWI data for 2021 until all participating states have reported, and even then, Alaska, Arkansas, and Mississippi do not participate. For these reasons, national CPS data are used to compare to the nation. The much larger national CPS sample reduces sampling error enough to analyze U.S. subgroups.