By Tim O'Neill
There is a common saying in Minnesota that there are two seasons: winter and road construction. This statement couldn't ring more true in Northwest Minnesota. With the beginning of October, the fourth quarter of 2013, numerous industry sectors will begin to lay off workers and downsize temporarily as they prepare for the long winter season. As seasonal work is highly cyclical in nature, the shifts in employment from one quarter to the next and from one season to the next can be analyzed historically, allowing for a better understanding of how regional economies will be affected.
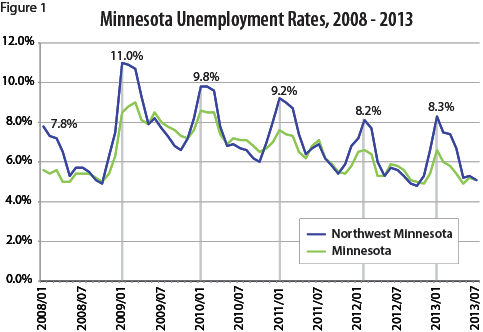
Historical unemployment rates show just how punctuated seasonal changes are in Northwest Minnesota. Both Minnesota and Northwest Minnesota tend to reach their lowest unemployment rates of the year in October and quickly spike to their highest rates in January. The difference in these rates, however, is much more significant in Northwest Minnesota. For example, between October 2012 and January 2013, unemployment statewide rose from 148,696 people to 195,602 people, an increase of 31.5 percent. Northwest Minnesota, on the other hand, witnessed a jump from 14,468 unemployed persons in October 2012, to 24,909 unemployed persons in January 2013. This represents an increase of 72.2 percent over three months. While this represents a large jump in unemployment over a short period of time, it is to be expected in Northwest Minnesota's regional economy. In fact, this stark change in unemployment has gone down in recent years. For example, between 2002 and 2009, the jump in unemployment between the months of October and January averaged 110 percent. Between 2010 and 2013, however, this seasonal jump in unemployment has averaged just 56 percent. Figure 1 shows historical unemployment rates for Minnesota and Northwest Minnesota. Note the much higher spikes in unemployment during the winter months in Northwest Minnesota.

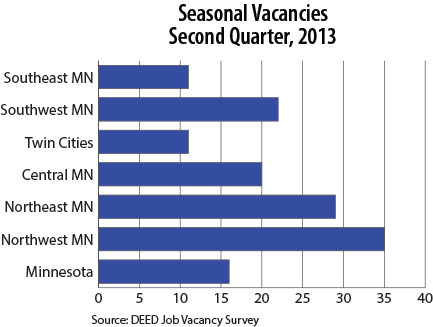
As of the second quarter of 2013, 16 percent of statewide vacancies were for temporary or seasonal work. In northwest Minnesota, 35 percent of vacancies reported were for temporary or seasonal work, the highest rate for all regions in the state (Figure 2.)

Identifying which industries are seasonal is fairly intuitive. With winter present industries such as construction, agriculture, and arts, entertainment, and recreation will slow down, while educational services will ramp up. As Northwest Minnesota's economy also relies significantly on tourism, accommodation and food services also proves to have a strong seasonal component. DEED's Job Vacancy Survey (JVS) Program shows the degree to which each industry is seasonal, as surveyed employers are asked to report how many current vacancies are considered temporary/seasonal.
Of those industries reporting seasonal vacancies, the highest percentage are found within administration and waste services, other services, public administration, construction, accommodation and food services, and arts, entertainment, and recreation (Table 1).
| Table 1 | ||||||
|---|---|---|---|---|---|---|
| Temporary/Seasonal Vacancies in NW Minnesota, Second Quarter, 2013 | ||||||
| NAICS Code | Industry Title | Temporary and Seasonal Percentage | Vacancies | Vacancy Rate | Median Wage | MN Temporary and Seasonal Percentage |
| 0 | Total, All Industries | 35% | 7,900 | 3.7 | $10.94 | 16% |
| 56 | Administrative and Support Services | 88% | 328 | 10.1 | $11.82 | 22% |
| 81 | Other Services, Ex. Public Administration | 79% | 181 | 3.0 | $14.26 | 11% |
| 92 | Public Administration | 76% | 909 | 6.2 | $9.99 | 50% |
| 23 | Construction | 67% | 575 | 5.6 | $15.40 | 40% |
| 72 | Accommodation and Food Services | 54% | 1,240 | 5.9 | $7.56 | 18% |
| 71 | Arts, Entertainment, and Recreation | 45% | 113 | 2.3 | $8.92 | 80% |
| 31 | Manufacturing | 31% | 548 | 2.0 | $15.84 | 16% |
| 11 | Agriculture, Forestry, Fishing, and Hunting | 30% | 122 | 2.8 | $9.46 | 52% |
| 61 | Educational Services | 30% | 481 | 2.2 | $21.10 | 21% |
| 53 | Real Estate and Rental and Leasing | 24% | 19 | 1.3 | $9.04 | 64% |
| Source: DEED Job Vacancy Survey (JVS) Program | ||||||
Another method of identifying which industries are seasonal and to what degree they are seasonal is to analyze the changes in quarterly employment. An effective way to do this is to create 'summer' seasonal employment, which averages second and third quarter employment figures, and 'winter' seasonal employment, which averages first and fourth quarter employment figures. Analyzing historical changes in employment from winter to summer reveals which industries are the most susceptible to seasonal changes. Since 2003, for example, employment in mining jumped by an average of 59 percent from winter to summer in Northwest Minnesota. Other Northwest Minnesota industries witnessing large employment jumps from winter to summer include arts, entertainment, and recreation, accommodation and food services, construction, and administrative and support services. Not surprisingly, educational services witnesses a decrease in employment between the winter and summer seasons.
These industries within Northwest Minnesota are, overall, much more seasonal than in all other regions of the state. Between the winter and summer seasons, employment within accommodation and food services in Northwest Minnesota increases by an average of 21.9 percent. This is a much more significant jump than any other region, including Northeast Minnesota, which witnesses an average seasonal jump of 13.7 percent.
Since 2003 the average employment for all industries increases by an average of 3.6 percent between the winter and summer seasons. This is significantly higher than all other regions of the state and Minnesota overall (Table 2).
| Table 2 | |||||||
|---|---|---|---|---|---|---|---|
| Northwest Minnesota Industries Exhibiting High Winter-Summer Seasonal
Employment Change, 2003-2013 |
|||||||
| Industry | NW | Central | NE | 7-County Metro Area | SE | SW | MN |
| Total, All Industries | 3.6% | 1.7% | 2.3% | 0.7% | 1.3% | 0.2% | 1.2% |
| Mining | 59.0% | 36.5% | -3.4% | 31.7% | 35.9% | 13.8% | 5.2% |
| Arts, Entertainment, and Recreation | 24.4% | 14.5% | 12.3% | 17.9% | 16.4% | 27.1% | 18.0% |
| Accommodation and Food Services | 21.9% | 5.7% | 13.7% | 3.9% | 6.1% | 2.9% | 6.4% |
| Construction | 21.9% | 19.2% | 17.2% | 11.3% | 13.9% | 19.5% | 14.4% |
| Administrative and Support Services | 14.8% | 6.7% | 4.5% | 3.0% | 3.6% | 5.5% | 3.7% |
| Agriculture, Forestry, Fishing, and Hunting | 6.2% | 15.4% | -6.2% | 53.6% | 4.7% | 1.2% | 12.9% |
| Public Administration | 5.4% | 3.5% | 5.3% | 3.2% | 6.0% | 6.4% | 4.2% |
| Educational Services | -13.8% | -13.0% | -12.3% | -7.0% | -10.3% | -16.1% | -11.1% |
| Source: DEED Quarterly Census of Employment and Wages (QCEW) Program | |||||||
Those occupations with a high percentage of temporary/seasonal vacancies can be found in such Northwest Minnesota industry areas as construction, accommodation and food services, and arts, entertainment, and recreation. For instance, within construction 98 percent of highway maintenance worker vacancies and 85 percent of operating engineers and other construction equipment operator vacancies are considered temporary or seasonal. Within accommodation and food services, 82 percent of waiter and waitress vacancies and 66 percent of hotel and resort desk clerk vacancies are considered temporary or seasonal. Within arts, entertainment, and recreation, 94 percent of recreational protective service worker vacancies and 83 percent of coaching vacancies are temporary or seasonal (Table 3).
| Table 3 | ||||
|---|---|---|---|---|
| Northwest Minnesota Job Vacancy Survey, Second Quarter, 2013Sorted by Occupations with High Temporary/Seasonal Vacancies | ||||
| Occupation | Vacancies | Vacancy Rate | Temporary/Seasonal Percentage | Hourly Median Wage |
| Total, All Occupations | 7,900 | 3.7% | 35% | $10.94 |
| Stationary Engineers and Boiler Operators | 10 | 5.1% | 100% | $21.85 |
| Highway Maintenance Workers | 72 | 9.1% | 98% | $9.78 |
| Landscaping and Grounds-keeping Workers | 279 | 23.8% | 97% | $10.20 |
| Lifeguards, Ski Patrol, and Other Recreational Protective Service Workers | 155 | 55.3% | 94% | $7.77 |
| Dishwashers | 62 | 21.2% | 87% | $7.27 |
| Operating Engineers and Other Construction Equipment Operators | 82 | 8.3% | 85% | $19.40 |
| Coaches and Scouts | 89 | 42.5% | 83% | $11.85 |
| Waiters and Waitresses | 211 | 23.7% | 82% | $7.34 |
| Human Resources Assistants, Except Payroll and Timekeeping | 11 | 3.9% | 79% | $8.00 |
| Mail Clerks and Mail Machine Operators | 6 | 5.4% | 79% | $17.54 |
| Bookkeeping, Accounting, and Auditing Clerks | 36 | 1.0% | 78% | $10.25 |
| Meat, Poultry, and Fish Cutters and Trimmers | 14 | 11.9% | 70% | $9.55 |
| Heavy and Tractor-Trailer Truck Drivers | 463 | 11.7% | 69% | $15.79 |
| Laborers and Freight, Stock, and Material Movers, Hand | 134 | 5.4% | 67% | $13.36 |
| Hotel, Motel, and Resort Desk Clerks | 64 | 10.3% | 66% | $9.12 |
| Source: DEED Job Vacancy Survey (JVS) Program | ||||
The high vacancy rates for occupations within construction, accommodation and food services, and arts, entertainment, and recreation also reinforce the seasonal nature of these positions. The job vacancy rate is defined as an estimate of the percent of job vacancies relative to all filled jobs in the occupation. Essentially, with high turnover in these positions, more openings are going to be available. There were 42.5 job openings per 100 jobs for coaches and scouts in the second quarter of 2013 indicating an extremely high demand for coaches and scouts during the summer months.
As 2013 rolls into the fourth quarter, Northwest Minnesota employers will begin to end summer seasonal employment. Those industries expected to witness the largest employment declines will be accommodation and food services, construction, and arts, entertainment, and recreation. In fact, going back to 2008, these three industries account for more than 90 percent of seasonal employment loss from quarters two and three (summer) to quarters one and four (winter) (Table 4). While these industries certainly decline in the winter months, they bounce back every summer as tourists stream north to visit the region's lakes and the construction season roars back from hibernation.
| Table 4 | |
|---|---|
| Northwest Minnesota Summer to Winter
Employment Change, 2008-2012 |
|
| Industry | Summer to Winter Employment Change, 2008-2012 Average |
| Numeric | |
| Accommodation and Food Services | -3,925 |
| Arts, Entertainment, and Recreation | -1,015 |
| Construction | -1,976 |
| Total, All Industries | -7,455 |
| Source: DEED Quarterly Census of Employment and Wages (QCEW) Program | |