by Nick Dobbins
September 2018
While CES and QCEW track related employment data, they measure slightly different universes.
Current Employment Statistics (CES) and Quarterly Census of Employment and Wages (QCEW) employment data are closely related. Both data sets are known primarily for their wage and salary employment counts, and both are useful in that regard.
Each one covers about 97 percent of wage and salary jobs in Minnesota and about 90 percent of all employment. Neither covers the self-employed, unpaid family workers or certain agricultural workers.
The CES is built on the back of the QCEW, pulling its survey sample from the QCEW universe, and benchmarking to QCEW every year. The primary difference between the two is that the survey-based estimates of CES allow for more timely data releases, with estimates published less than a month after the reference period, while QCEW's population data allow for much more granular geographic and industry data.
Despite their similarities and shared origins, comparing the total employment counts in these two data sets shows that CES reports around 75,000 more jobs in a given month. The disparity comes from the fact that these two tools are actually measuring slightly different universes, with certain types of jobs excluded from each. In fact, because each data set includes some jobs the other doesn't, the difference you see dramatically understates the true divide. In a given month there may be more than 120,000 jobs that are covered by one program but omitted from the other.
The reasons for this divergence are somewhat varied. The QCEW program relies on unemployment insurance (UI) reports for its data. This leads to gaps when jobs or industries are not covered by laws that govern UI. The lion's share of the difference between the two data sets comes from those jobs that are included in the purview of CES but are not covered, and are therefore not present, in QCEW data. As such, CES refers to these as "non-covered employment."
A diverse and otherwise unrelated array of jobs and industries comprises the non-covered employment that is included in CES estimates. Examples include railroad workers, private religious organizations, and students employed via work study at colleges and universities. A detailed breakdown of non-UI covered employment in CES is included in Table 1. In 2017, employees in religious organizations accounted for more than 30 percent of all non-covered employment in CES estimates.

A smaller but not insignificant number of job classes are included in QCEW data but excluded from the scope of the CES. Most notable are agricultural jobs, some but certainly not all of which are covered by UI. Agriculture is not present in CES because the many exemptions to UI coverage cause a poor sample frame for calculating quality estimates. Other out-of-scope employment for CES includes private households and the incorporated self-employed (many of which are also in agriculture).
It should be noted that QCEW originates as quarterly administrative reports by employers to UI and, as a result, not every report is completely accurate. While many of the mistakes are caught and cleaned very quickly, not all are caught in every report.
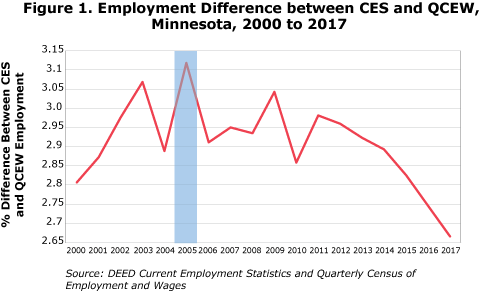
The employment difference between the two programs, while a permanent fixture, does fluctuate in size. In recent years, it has been steadily declining. As illustrated in Figure 1, 2017 annual averages displayed the narrowest gap between the two, going all the way back to at least 2000, the earliest year for which we have published data. The reasons for this, like the reasons for the employment differences themselves, are varied. There are, however, a couple of especially noteworthy forces driving the two counts together.
As noted in Table 1, employees of religious organizations and small nonprofits are the single largest group of non-covered employment in QCEW, and state government education is the second.
| Table 1. Major Areas of Non-Covered Employment in Current Employment Statistics | ||||
|---|---|---|---|---|
| Industry Group (Private Ownership Unless Otherwise Noted) | Relevant Non-Covered Jobs* (Presumed Excluded From QCEW but in CES) | CES Employment | QCEW Employment | Difference (Presumed Non-covered Employment) |
| Religious, Grantmaking, Civic and Professional Organizations | Employees of Religious Organizations and Some Small Nonprofits | 64,961 | 34,173 | 30,788 |
| State Government Education | Students Employed by a School Through Work Study Program | 59,282 | 40,207 | 19,075 |
| Local Government Excluding Education | Elected Officials, Judges and Others | 147,930 | 131,800 | 16,130 |
| Colleges, Universities and Professional Schools | Students Employed by a School Through Work Study Program | 26,004 | 18,045 | 7,959 |
| Elementary and Secondary Schools | Employees of Private Religious Schools | 21,674 | 14,399 | 7,275 |
| Local Government Education | CES is Adjusted for Staff With Summers Off | 144,775 | 138,182 | 6,593 |
| Transportation and Warehousing | Railroad Employees | 93,866 | 88,363 | 5,503 |
| Insurance Carriers and Related Activities | Commissioned Non-office Sales Agents | 61,736 | 57,530 | 4,206 |
| Hospitals and Offices of Physicians | Interns and Trainees | 185,287 | 182,256 | 3,031 |
| *Not all jobs within the described class are necessarily non-covered | ||||
| Source: DEED Current Employment Statistics and Quarterly Census of Employment and Wages data | ||||
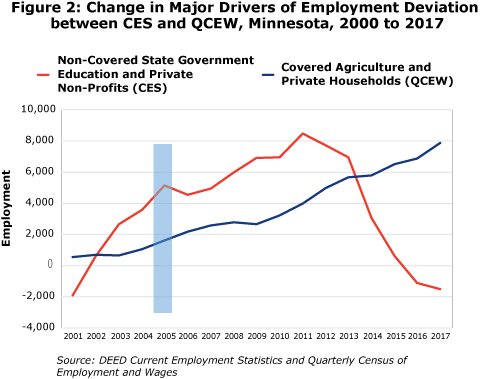
Since 2005, when the difference between CES and QCEW was the largest on record (83,563 jobs, or 3.12 percent), employment in both of these groups has shrunk. The non-covered employment gap in state government education has shrunk from 22,999 to 19,075, while the employment gap in religious, grantmaking, civic, professional and similar organizations (where religious organizations are situated) has dropped from 33,541 to 30,788 jobs. All told, the tightening in the two series accounts for 6,677 fewer non-covered jobs included in CES estimates over the given period (see Figure 2).

While employment included in the QCEW universe but excluded from CES represents a smaller subset of jobs than its inverse, it is big enough to make a noticeable difference. The bulk are agricultural jobs, with the next largest group in private households. Both of those classifications have been growing in recent years, in real numbers and as a proportion of total QCEW employment (see Figure 2).
Covered agriculture and private households combined added 16,772 jobs to QCEW's total employment in 2005. By 2017, that number was 23,039, with the proportion of total employment up from 0.65 percent to 0.81 percent over the period. As Figure 2 shows, this portion of employment has been steadily climbing for quite some time, which suggests that at least one force will continue pushing these two job counts closer together.