By Mohamed Mourssi-Alfash
March 2014
People with disabilities in Minnesota are more likely to be employed than in other parts of the country, but they still haven't fully recovered from the effects of the recession.
The U.S. labor market experienced extraordinary employment losses from the end of 2007 through 2009, with more than 8 million jobs lost nationally, including 160,000 in Minnesota. The Great Recession caused the U.S. unemployment rate to more than double, and many of those lucky enough to keep their jobs experienced pay cuts or hourly reductions. Others withdrew from the workforce altogether, causing the labor force participation rate to drop significantly.
People with disabilities were among the hardest hit populations during that period, with their employment rates declining sharply and not yet back to pre-recession levels.
To get a better idea of how people with disabilities were affected by the Great Recession, this analysis looks at disability employment over seven years in the U.S. and Minnesota, examining American Community Survey (ACS) data from 2006 to 2012 for people 16 years of age and older.
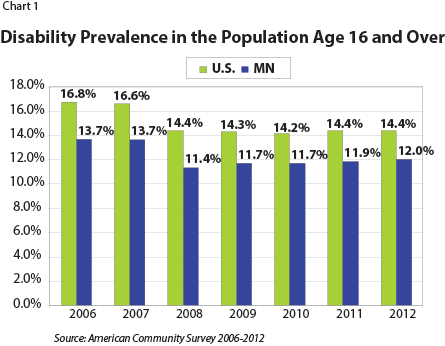
Disability prevalence in this report is the percentage of people in the entire population who reported at least one type of disability as defined by the ACS. Starting in 2008, however, the ACS adapted a narrower definition of disability than the definition used in earlier versions of the survey. This resulted in a significant change between 2007 and 2008 in the percentage of the population identified as having a disability, as Chart 1 clearly shows.

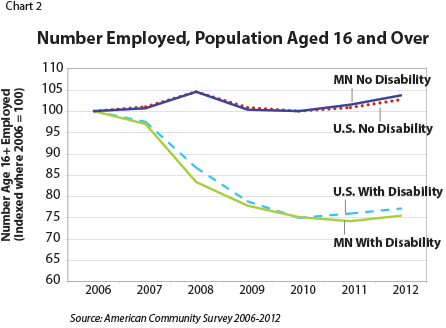
Chart 2 shows the trend in the number of employed people with and without disabilities in the U.S. and Minnesota from 2006 to 2012. As the graph shows, employment levels dropped dramatically for people with disabilities during the recession. They turned the corner nationally in 2011 but did not start to recover in Minnesota until 2012. In comparison, employment levels for the working-age population with no disabilities did not start to decline until after 2008 and began to regain ground again in 2011.

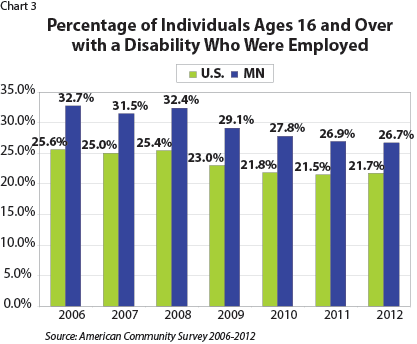
Chart 3 shows the decline in employment rates in the working-age population with disabilities from all groups in the U.S. and Minnesota during and after the recession. The data show that Minnesotans with disabilities had a higher employment-to-population ratio during that period than people with disabilities nationally. The peak level for disability employment prior to the Great Recession was in 2006, when the disability employment rate in Minnesota was 32.7 percent - 7.1 percent above the national rate of 25.6 percent.

The Minnesota disability employment rate dipped slightly in 2007 before trending upward again in 2008, getting close to the 2006 rate. In 2009 there was a substantial decline in employment as the number of employed working-age adults with disabilities in Minnesota dropped to 29.1 percent - 6 percent above the national rate. Employment of Minnesotans with disabilities continued to decline in 2010, 2011 and 2012, when it reached 26.7 percent. The Minnesota figures are consistent with U.S. disability employment ratios which continued to decline until 2012, when it climbed by 0.2 percent.
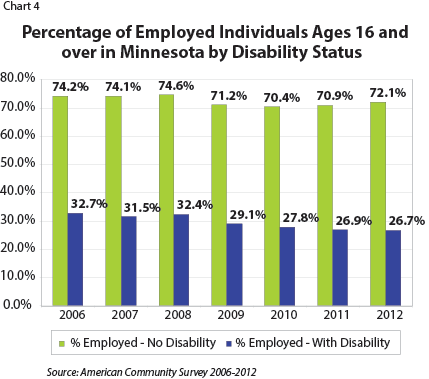
Chart 4 presents the employment rates of people with disabilities compared with those with no disabilities in Minnesota from 2006 to 2012. About 26.7 percent of the working age population with disabilities was employed in Minnesota in 2012, compared with 72.1 percent for those with no disabilities. Employment rates of people with a disability have continued to decline since the recession, while they rose in 2011 and 2012 for people with no disabilities.

The Great Recession affected the employment rates of all population groups, including people with disabilities. On the positive side, Minnesota's employment rate among people with disabilities is significantly higher than the country as a whole. The number of employed people with disabilities in Minnesota increased in 2012 by about 2,100 from the previous year, showing a positive move toward post-recession recovery.