
by Alessia Leibert
September 2020
Latinos are the fastest growing population group in Minnesota, having increased by 22.4% from 2005-10 to 2013-171. They work in some of the most in-demand sectors of the economy, including food manufacturing, health care, food services, and child care. Unfortunately Latinos have very low rates of health insurance and full-time employment, which make them particularly vulnerable to the economic downturn and job losses caused by COVID-19.
The contribution of Latinos to Minnesota's economy as well as their job security could improve if we could bridge the gaps in post-secondary educational attainment and job quality that have been documented in previous research. This study compares Latino with white students enrolled in a postsecondary school in Minnesota to identify education and employment disparities and examine how they develop so that solutions could be formulated to address them.
We'll answer the following research questions
Our dataset represents 951,462 students who attended a higher education program between July 2006 and June 2017, and reported being either Latino/Hispanic (from now on referred to as "Latino") or white non-Hispanic. Figure 1 presents size and key indicators of college readiness for each group. Latinos were more than twice as likely as whites (12.0% versus 4.9%) to participate in a General Education Development (GED) program or in Adult Basic Education, a program targeted at individuals who score below 12th grade level in areas such as math, reading and English language.
Table 1. Demographic and Post-Secondary School Characteristics 2006-2017
| Race | Number of students enrolled from July 2006 to June 2017 | % enrolled in an Adult Basic or GED Education program | % enrolled in remedial courses | % foreign-born* |
|---|---|---|---|---|
| Hispanic/Latino | 43,150 | 12.0% | 34% | 18.2% |
| White non-Hispanic | 908,312 | 4.9% | 18% | 0.8% |
| *We approximate foreign-born status in two ways. First, individuals who were naturalized U.S. citizens or became naturalized while in post-secondary school were considered foreign-born. Second, individuals who were reported as having Limited English Proficiency while in high school were considered foreign-born. This measure likely underestimates the real share of foreign-born Latinos because it misses those who did not attend a public high school in MN and acquired full U.S. citizenship before entering higher education.
Source: Statewide Longitudinal Education Data System |
||||
We also find alarmingly high rates of remediation, 34% compared to 18% among whites. Students are placed in supplemental instruction in core subjects like math and reading when they are unprepared to take college-level courses. Besides being an indicator of low academic preparedness, placement in remediation is also a well-known risk indicator for dropping out of post-secondary school.
Table 1 also includes information on the share of the student population who were born abroad and then became naturalized U.S. citizens. Approximately 18% of Latinos in higher education were foreign-born versus 0.8%of whites. Foreign-born individuals are more likely to face language barriers and to enter higher education as part of an Adult Basic Education program.
| About the Data |
|---|
|
This research relies on post-secondary student records and Minnesota wage records from the Statewide Longitudinal Education Data System (SLEDS). Student records cover all for-credit public and private programs in Minnesota. The dataset has 951,462 individuals ages 17 to 55 at the time of school exit who reported being either Hispanic/Latino or white non-Hispanic. We also restricted the analysis to individuals who had at least one employment record in Minnesota at any time. Employment and earnings outcomes are only for graduates who work in Minnesota as identified in administrative records of the state's Unemployment Insurance program. Although 97%of Minnesota businesses report wages, people who are self-employed or employed out of state are not covered by Minnesota's UI laws and are therefore not captured in our wage results. The race definitions used in this study are based on self-reporting, and the data collection instrument does not distinguish between Latino as a race and Hispanic as a cultural/linguistic/ethnic identification. |
Another key difference between Latino students and their white counterparts is the type of high school they attended, available for about 42% of individuals in our sample. As shown in Figure 1, one fourth (27%) of Latino post-secondary students attended a high poverty secondary school compared to 8.7% among white students. In contrast, white students were overwhelmingly more likely (41.7%) to have attended a low poverty school.2
Figure 1.
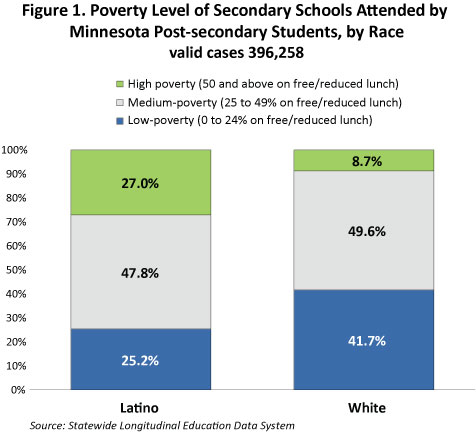
While the socio-economic characteristics of a school as a whole do not necessarily represent individual student characteristics, we also know that the Latino students in our sample who attended a Minnesota public school were twice as likely than their white peers (23.6% versus 11.6%) to be eligible for free or reduced-price lunch. The fact that nearly one out of four Latino students who attended a Minnesota public high school and later enrolled in college came from low-income families gives a glimpse of the barriers they had to overcome to access and persist in higher education.
Another characteristic that sets Latino students apart from their white peers is the racial diversity of the high school they attended, measured by the share of minority students enrolled in each school. As shown in Figure 2, 21.3% of Latino post-secondary students attended a secondary school with more than 50% minority students compared to 3.7% among their white counterparts. In contrast, white students were overwhelmingly more likely (81.8%) to have attended a secondary school where racial minorities represent less than 24% of the student body.
Figure 2.
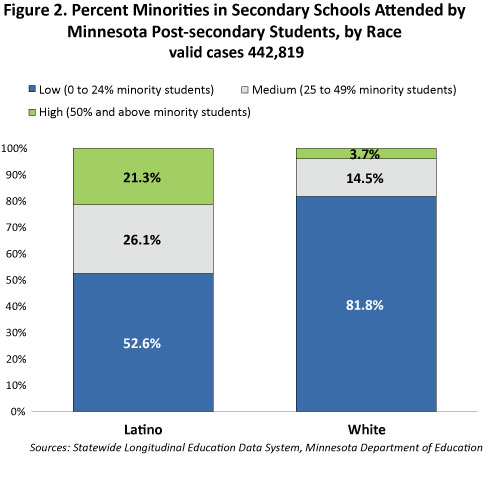
These findings are partially driven by the high concentration of Latinos in urban districts and particularly in charter schools, which typically enroll a higher percentage of students from low income families, a higher percentage of students of color, and a higher percentage of English Language Learners.
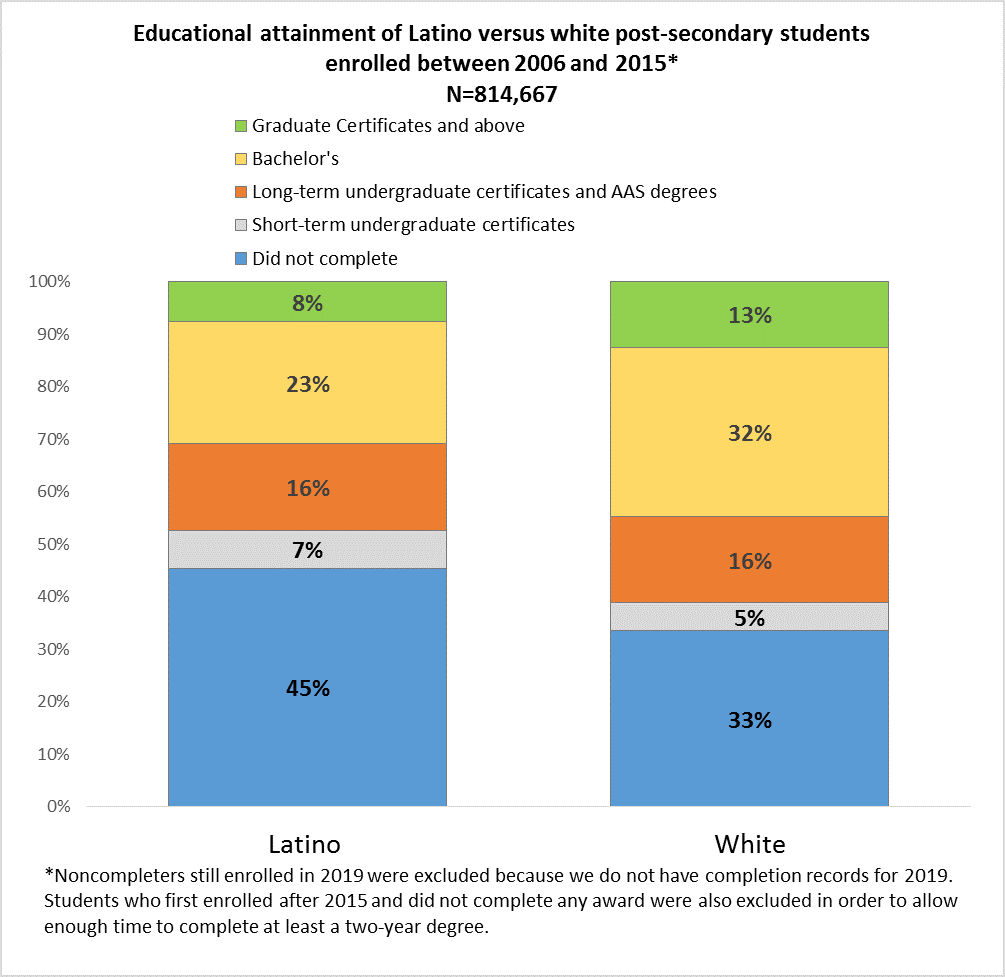
These overall findings show how high school experiences, as well as the circumstances of entry into higher education, are considerably more challenging for Latinos than for whites. These different background characteristics can contribute to an explanation of the gaps in post-secondary educational attainment shown in Figure 3. Forty-five percent of Latinos did not complete a credential compared to 33% of whites. Not only are whites more likely to finish post-secondary education, but they are also more likely to earn a Bachelor's degree (32% compared to Latinos at 23%) or an advanced credential (13% compared to Latinos at 8%).
Figure 3.
Despite these gaps, Latinos fare better than other racial minorities in educational attainment in Minnesota, trailing only behind whites and Asians3.
Besides credential completion, the field of study chosen also determines the payoffs from higher education. Figure 4 shows the top 20 most popular majors among Latinos and compares the concentration of Latinos and whites in each major. Important differences are found near the top of the list, where we find 9.3% of Latinos majoring in liberal arts versus whites at 6.0%, while only 5.5% majored in Education versus whites at 9.3%. Furthermore, the share of Latinos who majored in cosmetology or culinary services, which generally lead to low-paying occupations, is twice as large as whites, 4.1% versus 2.7%. Also relevant is the lower representation of Latinos in well-paid STEM fields such as engineering/engineering technologies and biological/biomedical studies. The STEM field where Latinos have the same representation as whites is Information Technology (2.5% of graduates), probably because the abundance of short-term credentials in IT appeals to students who do not have the resources to commit to a four-year degree.
Figure 4.
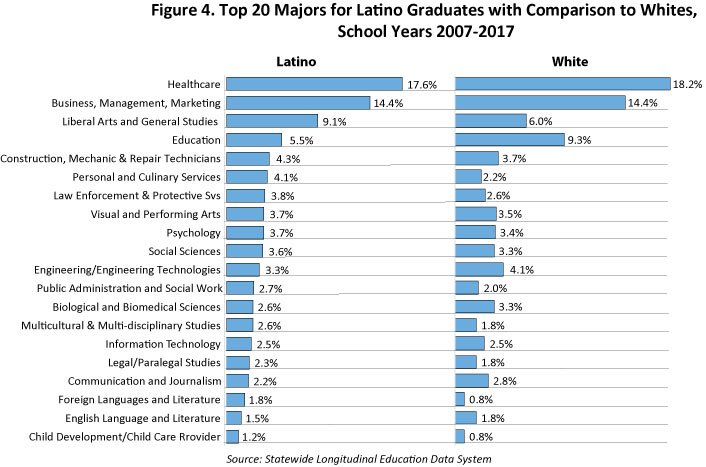
Latinos have a strong presence in the skilled trades, especially construction, mechanic and repair technologies (4.3% versus whites as 3.7%), which makes them employable in high-demand fields such as manufacturing, construction, automotive and HVAC repair services. Furthermore, they are likely to pursue programs with a cultural, social, legal and linguistic focus such as social sciences, legal studies, law enforcement and foreign languages. These programs can successfully prepare students for jobs where bilingual and bicultural skills are essential to successfully serve Latino communities, such as legal assistants, police officers, security guards, interpreters and community social service specialists.
However, the under-representation of Latinos in the health care and education fields requiring at least an Associate's degree prevents them from accessing licensed health care and education professions. The disparities in graduation rates in education and Registered Nursing programs are particularly problematic because they perpetuate the under-representation of Latinos in these licensed professions, at the same time as the number of Latinos needing culturally competent educational and health care services is growing.
Last but not least, differences in educational paths may not be simply a matter of personal choice but of low academic preparedness, lack of financial means to attend college for more than one year, and lack of role models. There is definitely evidence of Latino students aspiring toward other educational paths and facing barriers to completion. For example, rates of completion of Registered Nursing programs were 51% versus 71% among whites. Similarly, in the field of teacher education the rates of completion of a Bachelor's degree or above were 65% among Latinos and 81% among whites.
As a consequence of their under-representation in Bachelor' level education and STEM programs, Latinos with some college experience have far lower rates of employment in industries such as elementary and secondary schools (4.8% versus whites at 7.7%) and professional and technical services (3.5% versus whites at 5 5%), as shown in Figure 5. Instead, they are relatively more likely to find jobs in manufacturing (9.1%), accommodation and food services (8.8%), temp help agencies (4.8%), social assistance (4.6%), and waste management and administrative services (3.6%).
Figure 5.
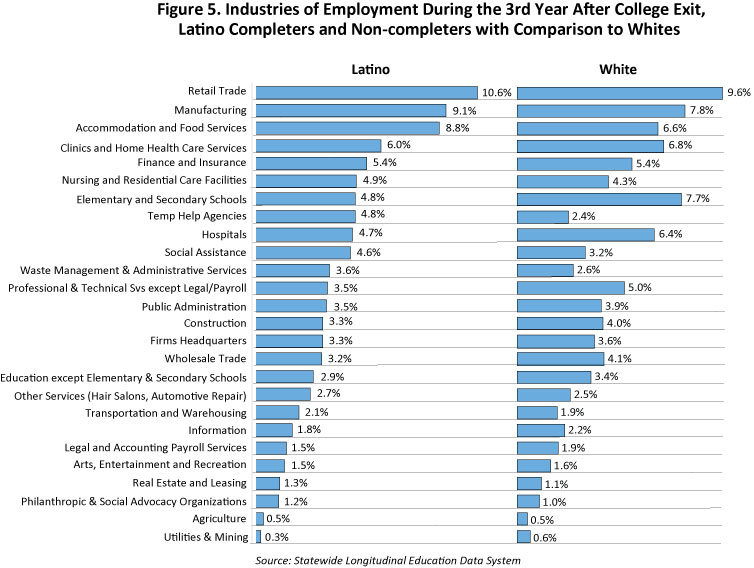
Within the healthcare industry, Latinos are more likely than whites to work in nursing and residential care facilities (4.9%) while whites are more likely to work in hospitals with better pay and career advancement opportunities.4
The strong presence of Latinos in manufacturing is particularly noteworthy for two reasons. First, Latinos were primarily employed in animal slaughtering/processing and food manufacturing in general, a sector that has long been experiencing chronic workforce shortages because of unattractive work conditions. Latinos are also employed in machine shops and machinery manufacturing, where employers are reporting severe labor shortages. Second, one out of four Latino students employed in manufacturing during the 3rd year after school exit was foreign-born. This signals that employers responded to workforce shortages by hiring recent immigrants of Latino background5.
Participation in post-secondary education is one of the best ways for Latino immigrant students to acquire not only technical skills but also the language skills needed to be employable. They have become a critical talent pool for employers especially in Greater Minnesota, where growth in the domestic population is too low to replace workers lost to retirements.
Within social assistance and waste management and administrative services, the leading sectors of employment for Latinos are also in high demand, such as child care centers, services for the elderly and disabled, janitorial and landscaping services, security guard services, and waste collection/remediation.
The most consequential gap between Latino students and their white peers as they transition from school into the labor market is not in the ability to find a job but in job quality defined as the likelihood of finding a full-time job. As shown in Figure 6, the likelihood of being employed full time in one job and being able to hold it for a year is higher for whites than for Latinos even after controlling for age and gender. White males who exited college between age 27 and 48 were significantly more likely than other groups to be employed full time year-round, with a share of nearly 70%.
Figure 6.
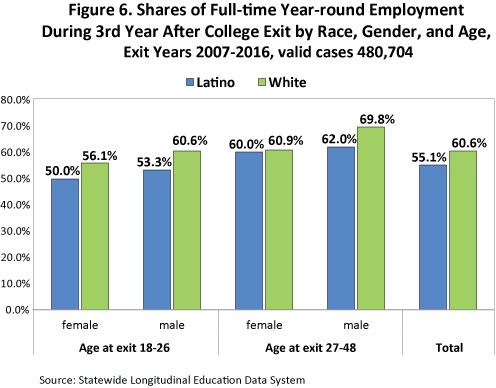
In contrast, Latino women had the lowest shares of full-time year-round employment, which made them particularly vulnerable to layoffs as a consequence of COVID-19. Since the beginning of the pandemic in March 2020, 46,697 workers of Hispanic ethnicity filed for unemployment benefits. Of those, women were more likely than men to report being permanently separated from their employers, most likely because of lower work hours and because they work predominantly in retail, food preparation and service, hair salons, and preschools which were hit hard by closures. In contrast, males are more likely to work in businesses considered essential such as meat-processing plants or other food manufacturing, agriculture, transportation/material moving, and construction.
Full-time year-round employment is not just a measure of job quality, but also of the well-being of workers and their families. It indicates a greater likelihood of job security, prospects for obtaining promotions, and access to health care and other benefits. Unfortunately, many Latinos in Minnesota are uninsured, in part because of greater shares of part-time work. Despite representing only 5.2% of the total population, they represent 20.9% of the uninsured6, making them the largest group without health insurance in the state.7 As a consequence, prolonged COVID-19-related layoffs or furloughs can push entire families into poverty and out of essential health coverage.
Are efforts to increase the educational attainment of minorities a good strategy for reducing racial disparities in full-time year-round employment? Evidence suggests they are. Figure 7 shows the improvement in job stability during the first seven years after college exit for the subset of students who completed a Bachelor's degree by age 26. Shares of full-time employment start low regardless of race because this is the time when new graduates seek their first full-time job. Shares jump during the second year and then climb gradually. By the third year, gaps are smaller than those presented in Figure 6 for the overall sample, indicating that educational attainment had the effect of reducing disparities. By the seventh year, 70% of Latino students were working full time year round versus 73% of white students.
Figure 7.
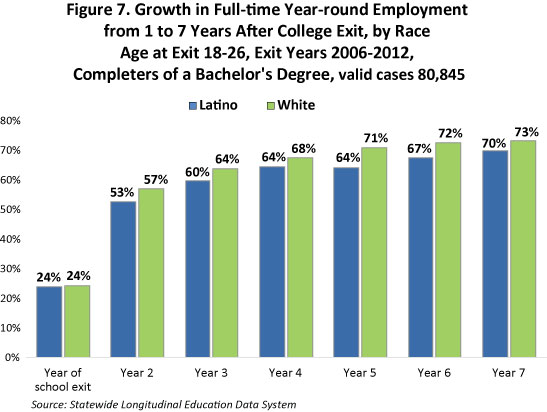
Although this evidence is encouraging, the fact that gaps do not entirely disappear suggests that disparities that develop within the workforce as early as the second year after degree completion are very difficult to eradicate.
Seventy-three percent of employed Latinos were working in the metro area during the 3rd year after school exit. Therefore, our analysis of wage outcomes focuses only on this most representative group. Figure 8 shows that during the year of school exit the median hourly wage for the youngest cohorts is very similar within each education level regardless of race. Racial wage gaps emerge right after leaving post-secondary school and persist even after controlling for age, education level, and region of work.
Figure 8.
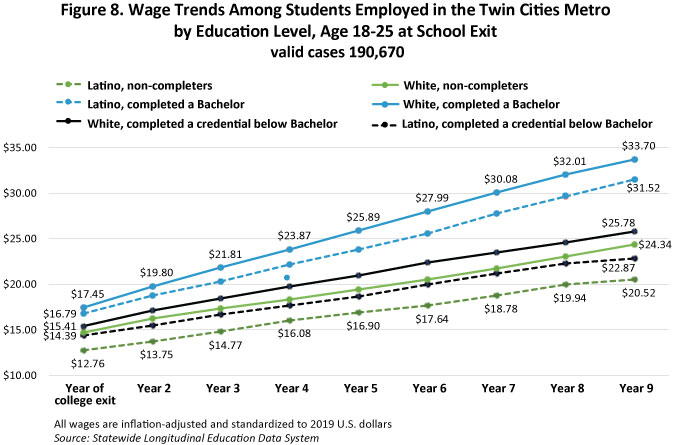
The most interesting result is that the earnings of Latino bachelor's degree completers trailed those of their white counterparts quite closely over nine years, culminating in a relatively small gap of 6.3% ($31.42 versus $33.77). In contrast, Latinos with no credential or with credentials lower than a Bachelor's lag further behind their white counterparts. The most concerning result is that Latinos with credentials below a Bachelor's (the black dashed line) earned less than whites without any credential (the solid green line). These disparities are likely due to the fact that whites pursued better paid majors and/or were able to access better paid industries even without formal credentials. Moreover, the "below bachelor" groups of Latinos face more barriers in that they include many more foreign-born, English language learners and low-income individuals than the bachelor-educated group.
These results paint a varied picture of the Latino community's labor market outcomes after college. On the one hand, a sizeable portion of students of Latino background complete four-year degrees and enter careers that pay salaries that have relatively small earnings gaps compared to their white peers. On the other hand, another group of Latino students select into shorter, less remunerative programs and are more likely than their white peers to drop out before finishing school. A complex mix of factors including socio-economic disadvantages, low academic preparedness, lack of role models, language barriers and barriers faced by first-generation students and/or DACA recipients probably contribute to disparities in outcomes.
In conclusion, completion of a college credential reduces racial wage disparities but not enough to eliminate them altogether. Interventions should be targeted specifically to Latino students from disadvantaged backgrounds where evidence points to the greatest disparities in labor market outcomes.
Using twelve years of post-secondary student records, this study casts light on the progress made by Latinos in higher education and the challenges that still prevent them from reaching their full potential in the labor market.
Here is a summary of findings:
Minnesota's economic competitiveness depends, in part, on Latinos' educational attainment. Any progress we as a society can make toward filling educational achievement and job quality gaps among all population groups, but particularly racial minorities, can help employers diversify their workforce, prevent workforce shortages, increase the well-being of families and communities and build a more equitable Minnesota.
1From 2005-10 to 2013-17, people of Hispanic or Latino origin grew at a rate of 22.4%. Source: US census Bureau, American Community Survey 5-Year Estimates. Source: US Census Bureau, American Community Survey 5-Year Estimates. The number grew from 233,716 in 2005-10 to 284,649 in 2013-17.
2Low poverty in this study is defined as having less than 25% of students eligible for free or reduced-price lunch. Although the socio-economic characteristics of a school as a whole do not necessarily represent individual student characteristics nor school quality, schools in low-income communities tend to have fewer resources than those serving predominantly wealthy communities, and differences in the education and/or income level of parents also influence learning experiences.
3To compare the educational attainment of Latinos to other races besides whites, see Graduate Employment Outcomes by Race dashboard.
4For detailed information on industries of employment and wages by race see the Graduate Outcomes Dashboard.
5Some Minnesota manufacturers send their recruiters to the border with Mexico to recruit Latino welders because they cannot find skilled applicants locally. Source: Minnesota 2019 Hiring Difficulties Survey.
62013-2017 American Community Survey 5-Year Estimates, table S2702, Selected characteristics of the uninsured in Minnesota.
7Among Latinos of prime working age as defined in our study (18 to 45), 26% are not insured. Source: American Community Survey 1-Year estimates 2017.