by Anthony Schaffhauser
June 2024
With employment now gaining ground – total employment has surpassed its prior high of 2019 both in Northwest Minnesota and in Minnesota statewide – it is natural to think of this as a new era. With that frame of mind, we assess the state of the Northwest Minnesota labor market from the long-term trend perspective.
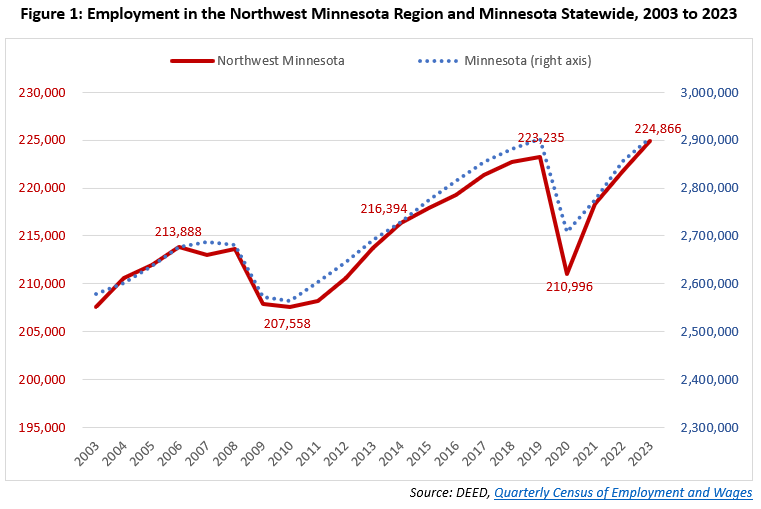
Employment in Northwest recovered from the Pandemic Recession by 2023 (Figure 1). This was a much faster recovery than after the Great Recession. Northwest Minnesota's annual employment was at its Great Recession low in 2007 at 207,548 jobs, and it took until 2014 to surpass the prior annual employment high of 213,888. So, while the economic expansion after the Great Recession was the longest in history, the labor market only started gaining ground about halfway through it.

In contrast, at just two months long the Pandemic Recession was the shortest in history and was followed by a historically tight labor market with a record number of job vacancies and record low unemployment. In 2022, there were an estimated 2.5 vacancies for every job seeker in Northwest. So, even if every job seeker had been an immediate fit for an open job, 60% of jobs would still have gone unfilled. Clearly employment would have recovered even faster if there had been enough workers for all the open positions.
The Northwest has 1,631 more jobs in 2023 than in 2019, which is 0.73% growth. Remarkably, 0.73% happens to be the annualized job growth rate from 2013 to 2019. Job growth appears to have picked right back up where it left off. The 2023 employment recovery matches the growth trend from right about when the labor market recovered from the Great Recession up until the pandemic. Does this mean everything is back to normal?
While overall employment is back, employment for some industry sectors is drastically different. From 2015 to 2019, ten of the 20 industry sectors had significantly above average growth: Agriculture, Construction, Manufacturing, Finance & Insurance, Professional & Technical, Educational Services, Health Care & Social Assistance, Accommodation & Food Services, Other Services and Public Administration. Of these ten, only Agriculture, Manufacturing, and Other Services, have continued 2015 to 2019 growth with similar growth from 2019 to 2023. The other seven had their trend altered by the pandemic (see Table 1).
| Table 1: Northwest Minnesota Industry Employment Trends, 2015 to 2023, and 2023 Average Weekly Wages | |||||||||
|---|---|---|---|---|---|---|---|---|---|
| NAICS Code | Industry Title | Employment | 2015 to 2019 Change | 2019 to 2023 Change | 2023 Avg. Weekly Wages | ||||
| 2015 | 2,019 | 2023 | Jobs | Percent | Jobs | Percent | |||
| 0 | Total, All Industries | 217,864 | 223,235 | 224,866 | +5,371 | +2.5% | +1,631 | +0.7% | $988 |
| 11 | Agriculture, Forestry, Fish & Hunting | 5,046 | 5,288 | 5,502 | +242 | +4.8% | +214 | +4.0% | $1,023 |
| 21 | Mining | 243 | 210 | 214 | -33 | -13.6% | +4 | +1.9% | $1,349 |
| 23 | Construction | 10,856 | 11,370 | 12,983 | +514 | +4.7% | +1,613 | +14.2% | $1,303 |
| 31 | Manufacturing | 28,625 | 29,478 | 30,203 | +853 | +3.0% | +725 | +2.5% | $1,239 |
| 22 | Utilities | 1,318 | 1,283 | 1,289 | -35 | -2.7% | +6 | +0.5% | $1,945 |
| 42 | Wholesale Trade | 11,452 | 11,150 | 11,590 | -302 | -2.6% | +440 | +3.9% | $1,334 |
| 44 | Retail Trade | 27,907 | 27,844 | 28,114 | -63 | -0.2% | +270 | +1.0% | $647 |
| 48 | Transportation & Warehousing | 6,386 | 6,117 | 6,059 | -269 | -4.2% | -58 | -0.9% | $1,032 |
| 51 | Information | 2,885 | 2,600 | 2,602 | -285 | -9.9% | +2 | +0.1% | $1,202 |
| 52 | Finance & Insurance | 5,784 | 5,961 | 5,824 | +177 | +3.1% | -137 | -2.3% | $1,448 |
| 53 | Real Estate & Rental & Leasing | 1,469 | 1,510 | 1,563 | +41 | +2.8% | +53 | +3.5% | $890 |
| 54 | Professional & Technical Services | 4,414 | 4,751 | 4,590 | +337 | +7.6% | -161 | -3.4% | $1,291 |
| 55 | Management of Companies | 880 | 695 | 549 | -185 | -21.0% | -146 | -21.0% | $2,109 |
| 56 | Admin. Support & Waste Mgmt | 5,258 | 4,075 | 3,997 | -1,183 | -22.5% | -78 | -1.9% | $820 |
| 61 | Educational Services | 21,453 | 22,683 | 22,427 | +1,230 | +5.7% | -256 | -1.1% | $956 |
| 62 | Health Care & Social Assistance | 36,690 | 39,185 | 39,089 | +2,495 | +6.8% | -96 | -0.2% | $1,079 |
| 71 | Arts, Entertainment & Recreation | 4,815 | 3,539 | 3,730 | -1,276 | -26.5% | +191 | +5.4% | $450 |
| 72 | Accommodation & Food Services | 20,452 | 22,294 | 22,184 | +1,842 | +9.0% | -110 | -0.5% | $428 |
| 81 | Other Services, Ex. Public Admin | 6,534 | 6,731 | 6,912 | +197 | +3.0% | +181 | +2.7% | $585 |
| 92 | Public Administration | 15,397 | 16,466 | 15,444 | +1,069 | +6.9% | -1,022 | -6.2% | $1,115 |
The goods-producing industry sectors (Agriculture, Forestry, Fishing & Hunting, Mining, Construction and Manufacturing) generally fared better through the Pandemic Recession than the rest, which are services-producing sectors.1 In fact, employment in the entire goods-producing domain grew 3.5% in the four years prior to the pandemic, then had faster 5.5% growth since 2019. Goods producing sectors also have above average paychecks, adding wealth to the Northwest region. In contrast, employment for all services sectors combined grew 2.2% from 2015 to 2019 and declined 0.5% from 2019 to 2023.
Agriculture has been on a mostly non-stop employment growth trend since the early 2000s. Employment declined slightly in 2021, but 2022 exceeded 2019, and growth continued for 2023. Manufacturing is the second largest employing industry sector in the region and the largest of the goods-producing sectors, so its 3% growth from 2015 to 2019 provided the largest job gains. Manufacturing declined in 2020 but resumed job growth in 2021 and employment was above 2019 levels by 2022. Manufacturing is nearing its job count from back in 2004, at 30,304 jobs, but productivity increases have limited the need for greater numbers of workers.
Construction had declined from its 2004 peak of 11,943 jobs to 9,688 in 2011. Growth ensued from there through 2019, but nothing like the surge during the pandemic. In 2021, Construction reached a new peak of 13,474 jobs. Although it took a breather in 2022, dropping to 12,514 jobs, it grew 3.7% from 2022 to 2023. This construction boom also stabilized Mining employment, which had been declining. Mining in the Northwest mainly supplies sand and gravel for construction. The pandemic recovery substantially strengthened Construction's prior growth trend.
Like Construction, Wholesale Trade exited the Pandemic Recession with a strong employment uptrend. However, it had been trending down from its prior peak of 11,491 jobs in 2014. Employment dropped to 10,977 in 2020, and it started an uptrend in 2021. Wholesale Trade is the pandemic recovery star of the services-providing domain, adding the most jobs and having the second fastest growth behind Arts, Entertainment & Recreation. With the highest average weekly wages of any services sector with an employment growth trend, Wholesale Trade is a driver of the region's prosperity.
Like Wholesale Trade, Retail Trade and Arts, Entertainment & Recreation made a turnaround from employment decline to growth in the pandemic recovery. Real Estate & Rental & Leasing and Other Services are the other two services sectors with growth, but rather than making a turnaround, both are continuing their prior uptrend.
Finally, the following four industries had their pre-pandemic downtrends moderate in the pandemic recovery: Utilities, Transportation & Warehousing, Information and Administrative Support & Waste Management. Only one sector, Management of Companies, was in a downtrend that continued unaltered by the pandemic.
Educational Services, Health Care & Social Assistance, Accommodation & Food Services and Public Administration are four of the region's five largest services industries. Retail Trade is the fifth largest employing industry. You can read the assessment of these industries in December 2023, which remains relevant and true.
Health Care & Social Assistance peaked in 2018 and has yet to reestablish a growth trend in Northwest, declining in 2022 and remaining below 2021 levels in 2023. Statewide, Health Care continued growing from 2018 to 2019, and in 2023 it exceeded 2019 levels. The Nursing & Residential Care Facilities subsector has a larger share of employment in the Northwest, so challenges recruiting and retaining employees in this subsector is holding back employment. Thus, health care worker demand is intact, but is in large part unfilled. However, in 2023, Nursing & Residential Care employment had its first employment gain since 2018, perhaps signaling the start of a much-needed turnaround.
Educational Services and Accommodation & Food Services are on track to regain their pre-pandemic employment uptrends in the near future. Both increased employment every year since 2020, putting Educational Services just 1.1% below pre-pandemic employment while Accommodation & Food Services is within 0.5%.
The remaining three service sectors were in pre-pandemic uptrends but show little to no employment recovery: Finance & Insurance, Professional & Technical Services and Public Administration. Public Administration had anemic growth since 2021 and is the furthest behind 2019 job counts of any sector. Not only does this reverse the above-average growth trend prior to the pandemic, it is also unique to the region. Statewide, job counts are now slightly above 2019.
Both Finance & Insurance and Professional & Technical Services are down from 2021, but those industries "had some of the fastest wage growth since the pandemic, even while employment was declining." This implies that technology is allowing professionals in these two industries to be more productive while relying on fewer lower-paid support staff.
Northwest Minnesota saw a record low 2.0% unemployment rate in September and October 2022, signaling the tightest labor market since the data became available on a regional basis in 1990. This record was tied the following year in October 2023. In March 2024, the unemployment rate was 4.2%, way down compared to 5.8% in March 2019. The acute impacts of the pandemic are largely behind us. There are some chronic impacts such as increased retirements and people with long COVID symptoms not able to work or working fewer hours. However, there is no sign these impacts are increasing, and Northwest's labor force has been growing.
The Northwest had an average of 303,284 workers in 2019 but grew to an average of 308,191 by 2023, increasing by 4,907 workers, or 1.6%. In comparison to the data shown in Table 1, total jobs increased 0.7% from 2019 to 2023. So, we would expect the labor market to have loosened with the additional workers.2 However, the long-term demographic trends, namely the retiring Baby Boomers, are keeping Northwest's labor market remarkably tight. Note that retirees do not supply labor, but still demand goods and services.
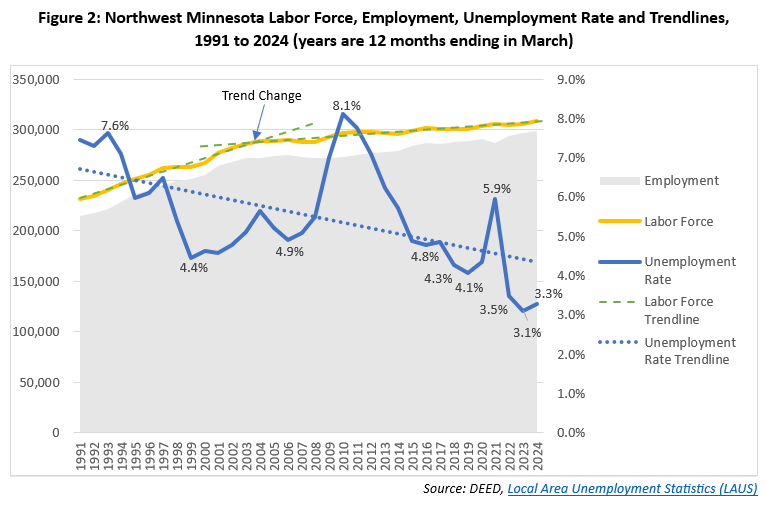
Figure 2 shows the labor force growth trend and how the retiring Baby Boomers impact it. Note that to use the most recent data, the years in the figure are the 12 months ending with March of the named year. So, 2024 is actually representing April 2023 through March 2024. Drawing a best-fit trendline from 1991 to 2002 and extending this line forward in time shows how the labor force growth trend changes around 2002, primarily due to the impact of the Baby Boom generation. The trendline continues to rise above the labor force line below. Drawing another best-fit trendline from 2002 to 2024 and extending it backward in time illustrates the trend change from the other end.

This trend change can also be expressed numerically. The annualized growth rate of the labor force from 1991 to 2002 was 1.8% per year. From 2002 to 2024 the annualized growth is 0.4%, meaning labor force growth was 4.5 times faster from 1991 to 2002 than in the past 20 years.
The trend change reflects the experience of the Baby Boomers, born between 1946 and 1964, aging out of the prime working years of age 25 to 54. The oldest Baby Boomers started turning age 55 in 2001. Back in 2000, the labor force participation rate (LFPR) for people aged 25 to 54 was 86.3%, while it dropped to 69.6% for people aged 55 to 59 (U.S. Census Bureau, 2000 Decennial Census SF3, Table PCT035).
Moving forward in time by 15 years, the Baby Boomers continue to age and their LFPR continued to drop, down to 68.8% for people aged 55 to 64 and 24% for people aged 65 to 74 (U.S. Census Bureau, 2015 ACS 5-year estimates). For age 75 years and over, which the Baby Boomers started reaching in 2021, the LFPR drops to 6.2% (U.S. Census Bureau, 2022 ACS 5-year estimates).
What's more, the generations after the Baby Boomers are not replacing them. Generation X (formerly referred to as the Baby Bust) is not large enough; the Northwest has about a third more Baby Boomers than Gen Xers. Also, many Millennials moved away when they were in their 20s. There were 75,812 people aged 15 to 24 in 2000, but ten years later there were only 61,193 people aged 25 to 34 in 2010, representing a significant loss of people over a 10-year period. (U.S. Census Bureau, Population Estimates)
These demographic trends were masked by the Great Recession and only started to surface again in 2018 when the annual unemployment rate hit a then record low of 4.3% (Figure 2). More record low unemployment rates followed the pandemic. While it seems like the pandemic was the singular cause, the trends that led to the tight labor market started over two decades ago and continue today. The 2024 unemployment rate remains remarkably low at 3.3%, and the long-term unemployment rate downtrend is clearly shown in Figure 2.
That said, the national unemployment rate is higher for January through March 2024 than these same months in 2023. While this unemployment rate increase is not yet as noticeable in Minnesota nor the Northwest, we may be in store for some labor market loosening. However, we have five more years until the youngest Baby Boomers reach age 65, so we are predisposed to having a tight labor market for the foreseeable future.
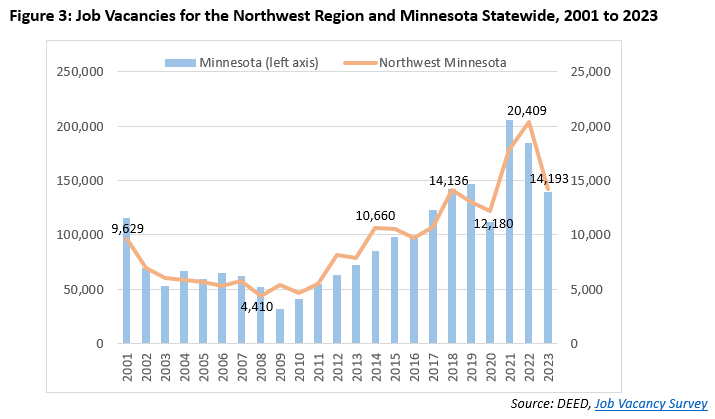
Normalization of job vacancies is the clearest sign that the historic labor market tightness is easing. While the over 30% drop in Northwest job vacancies seems drastic, the number of job vacancies in 2023 is almost exactly at the 2018 pre-pandemic peak (Figure 3). Statewide it has eased back slightly below the pre-pandemic peak. Of course, the labor market prior to the pandemic was historically tight relative to the prior two decades.

Like with the industry employment trends above, the job vacancy changes in 2023 are far from uniform (Table 2). Five of the 20 industry sectors had increased job vacancies compared to 2022, despite the overall drop. Construction and Utilities had rapid increases, indicating strong hiring demand. Arts, Entertainment & Recreation and Public Administration job vacancies also increased significantly, while Finance & Insurance saw little change.
| Table 2: Northwest Minnesota Job Vacancies, Vacancy Rate, and Median Wage Offer, 2023 | ||||
|---|---|---|---|---|
| NAICS Industry Title | 2023 Job Vacancies | Percent Change from 2022 | 2023 Vacancy Rate | 2023 Median Wage Offer |
| Total, All Industries | 14,193 | -30.5% | 6.4 | $17.77 |
| Health Care & Social Assistance | 3,428 | -6.0% | 8.9 | $19.89 |
| Retail Trade | 2,662 | -49.5% | 9.5 | $15.97 |
| Accommodation & Food Services | 2,121 | -19.7% | 10.0 | $14.82 |
| Educational Services | 1,283 | -57.9% | 5.5 | $17.97 |
| Manufacturing | 1,088 | -41.2% | 3.7 | $21.95 |
| Construction | 786 | +125.2% | 6.1 | $13 .93 |
| Public Administration | 727 | +47.5% | 4.7 | $22.30 |
| Wholesale Trade | 466 | -2.9% | 3.9 | $22.85 |
| Arts, Entertainment & Recreation | 433 | +39.7% | 12.5 | $15.72 |
| Transportation & Warehousing | 380 | -46.7% | 6.2 | $19.58 |
| Admin. Support & Waste Mgmt. Svcs. | 259 | -35.1% | 8.0 | $15.99 |
| Professional & Technical Services | 131 | -11.5% | 2.9 | $34.10 |
| Other Services | 96 | -71.0% | 1.5 | $15.06 |
| Management of Companies | 86 | -34.4% | 15.0 | $23.41 |
| Finance & Insurance | 85 | +1.2% | 1.5 | $17.18 |
| Agriculture, Forestry, Fishing & Hunting | 59 | -60.1% | 1.0 | $21.89 |
| Utilities | 38 | +322.2% | 3.0 | $24.03 |
| Information | 38 | -84.8% | 1.5 | $21.17 |
| Real Estate & Rental & Leasing | 22 | -57.7% | 1.4 | $16.59 |
| Mining | 7 | -89.1% | 2.7 | $25.17 |
| Source: DEED, Job Vacancy Survey | ||||
Besides Construction, vacancies dropped off in the goods-producing domain. However, wage offers for the vacancies remain well above average. Goods-producing industries also had below average job vacancy rates. Job vacancy rates are the number of vacancies relative to the number of people currently employed. They measure the magnitude of hiring demand relative to the size of the industry, and high rates can indicate more intense staffing needs.
The industries looking to staff up are those with above average job vacancy rates and increases in job vacancies, or below average decreases in job vacancies in the current situation where vacancies declined 30.5% overall. This includes Accommodation & Food services, Arts, Entertainment & Recreation, and Health Care & Social Assistance. The industry employment data (used for Table 1) backs this up as the number of jobs from 2022 to 2023 increased 3.0%, 5.2%, and 2.2%, respectively in these industries. Management of Companies is an anomaly with declining employment and declining job vacancies, yet the highest job vacancy rate.
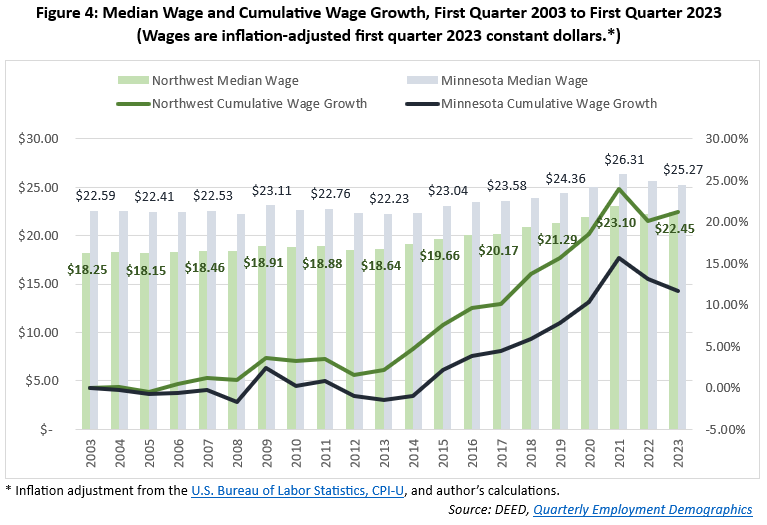
Increased wages are one of the most significant changes triggered by the tightening labor market. Wages in Minnesota and the U.S. were little changed from first quarter 2003 to first quarter 2014 (see Figure 1 for Minnesota and The FRED Blog (2/8/2018), "What's Real about Wages?" for U.S. data.) In contrast, Northwest Minnesota wages increased 4.6% over this time, but were $19.10 in first quarter 2018, compared to $22.32 for Minnesota (in inflation-adjusted first quarter 2023 dollars). That was less than 86% of the statewide wage.

Recall that in 2018, the unemployment rate in Northwest set a new record low of 4.3%, beating the prior record of 4.4% in 1999 (Figure 2). That's when the tightening labor market went to work on wages. From first quarter 2018 to 2023, cumulative real (inflation-adjusted) wage growth was 16.6% in the Northwest and 12.7% in Minnesota. Compare that five-year increase to the eleven-year increase of 4.6% for the Northwest, and a -1.0% decrease for Minnesota from first quarter 2003 to first quarter 2014. Note that the 2021 peak in wages reflects many lower-wage workers being unemployed while wages were paid to higher paid workers who remained employed. The tight labor market brought on a substantial increase to workers' purchasing power throughout the state. What's more, the increase brought Northwest wages to nearly 90% of the statewide wage.
The takeaway from this assessment of the state of Northwest Minnesota's labor market is how dissimilar the pandemic recovery has been compared to the labor market situation of the last three decades. During the past four years, we have set record lows for the unemployment rate and record highs for job vacancies. These short-term pandemic recovery driven changes brought the longstanding demographic-driven workforce challenges to the forefront. However, the changes also rapidly boosted real wages which had already begun increasing. While there are recent signs of loosening, the labor market remains tight compared to the 30 years prior to 2021. With the more extreme conditions of the pandemic recovery behind us, we can start to see more lasting trends emerge.
Besides the speed, a key difference of the Pandemic Recession recovery from the Great Recession recovery is that employers' ability to recruit and retain workers became nearly as important to growth as the demand for the goods and services that the business produces. This creates a huge incentive to increase productivity, and advancements in automation, information technology and artificial intelligence are promising in this regard.
Some industries or some occupations within industries will experience staff decreases due to technology advancements. Others will be able to raise wages to recruit the needed workers due to worker productivity gains that make higher wages feasible. As long as businesses can figure out how to produce enough goods and services to meet demand, a new long-term trend of low unemployment and rising real wages is great for the region.
1In the North American Industry Classification System (NAICS), the goods-producing sectors have lower-numbered codes and are listed first. Services-providing sectors have higher numbered codes, except for Utilities. The production operations of Utilities are more like the goods-producing industries, but Utilities are consumed as a service.
2That is assuming there was no large increase in Northwest Minnesota workers holding jobs outside the region, and no big increase in workers holding full-time jobs instead of part-time jobs, either of which would lower the region's job count relative to the resident labor force.