by Tim O'Neill
June 2017
The June 2016 Minnesota Economic Trends featured an article on the Twin Cities Metro Area titled “Addressing a Tighter Labor Market”. A year later the region’s labor market has continued to tighten. In the face of record-high employment vacancies, low unemployment, and decreasing labor force growth, employers in the Twin Cities will need to get creative in order to sustain economic vibrancy.
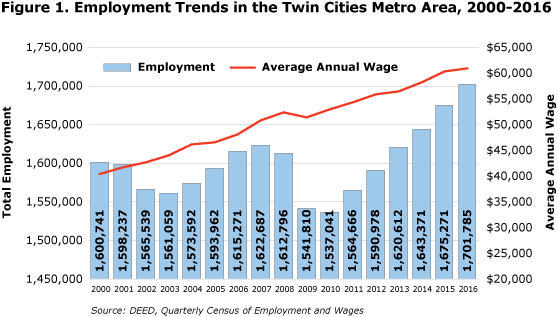
Since reporting the Twin Cities’ tight labor conditions in June 2016, the region has continued to grow like clockwork. Between annual 2015 and 2016 total covered employment increased by 1.6 percent or over 26,500 jobs. Adding nearly 165,000 jobs since the recessionary low in 2010, total employment in the region has topped 1.7 million jobs for the first time ever (see Figure 1). This growth has been led by Health Care and Social Assistance, Professional, Scientific, and Technical Services, Construction, and Accommodation and Food Services.

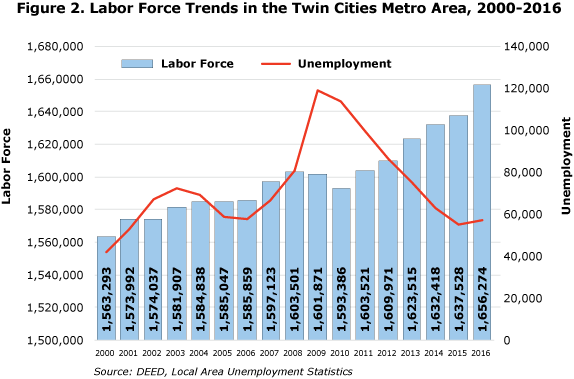
While total employment continues to move in a healthy direction, labor force trends within the Twin Cities may threaten future growth. Within the last six years of available data, between 2010 and 2016, the Twin Cities’ total labor force grew by an annual average of 0.7 percent. For some historical context, the region’s labor force growth averaged 1.6 percent per year in the 1990s before taking a hit in the 2000s with the Great Recession. While the labor force managed to break 1 percent growth between 2015 and 2016, the Minnesota State Demographic Center projects growth to slow significantly over the next decade. These trends will be the consequences of major shifts in the labor force, notably Baby Boomer retirements.1
Meanwhile, unemployment in the Twin Cities continues to drop. As of May 2017, the region’s 3.2 percent unemployment rate reflected approximately 53,500 people. (See Figure 2.) This was less than half of the 130,900 unemployed persons during the height of the Great Recession, when the unemployment rate spiked at 8.1 percent in June 2009. During the second quarter 2009, the Department of Employment and Economic Development’s (DEED) Job Vacancy Survey reported about 17,400 job vacancies. As such, there were 7.6 unemployed persons for every vacancy reported. Today, with over 57,700 vacancies, there is less than one (0.9) unemployed person for every vacancy reported. Essentially, the supply of available workers in the Twin Cities Metro Area is too low to meet the demand. This may constrain the healthy rate of growth the region has witnessed since 2010.

With the Twin Cities labor market as tight as it is, employers in the region will need to embrace more creative strategies for capturing and retaining workers. “Addressing a Tighter Labor Market” emphasized the Metro’s greater diversity and how removing barriers to employment for workers of other races and ethnicities is more important than ever before. Other populations to consider reaching out to include those with disabilities, youth, and those with less educational attainment.
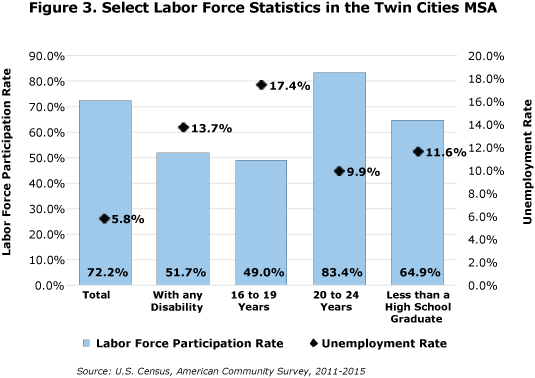
Within the Minneapolis-St. Paul Metropolitan Statistical Area (MSA), the 2015 overall labor force participation rate2 was 72.2 percent, and the unemployment rate was 5.8 percent.3 Those with reported disabilities, however, had a labor force participation rate of 51.7 percent, and an unemployment rate of 13.7 percent. These data essentially reveal that those with disabilities are either discouraged from looking for work or are having more difficulty securing work while actively looking for employment opportunities. Employers feeling the constraints of the tight labor market, therefore, should reach out more to those with disabilities. What is more, research and testimonials from employers have consistently shown that hiring people who have disabilities comes with numerous benefits. Chief among these benefits is that people with disabilities demonstrate high levels of performance, productivity, and loyalty, while contributing significantly to business innovation.4
Turning to youth in the Minneapolis-St. Paul MSA, their respective labor force participation rates and unemployment rates also suggest some slack in the labor market where employers can focus their hiring. More specifically, those 16-19 years old have a labor force participation rate below 50 percent. As well, of those participating in the labor market, the unemployment rate hovers above 17 percent. While the lower labor force participation rate suggests many 16-19 year olds are still in school or otherwise preoccupied, the high unemployment rate reveals a disconnect with a labor market desperate for workers. While these two labor market indicators have trended in positive directions since the end of the Great Recession5 and improved dramatically for those 20 to 24 years of age, employers will need to adapt to the ever-changing expectations of the Millennial Generation (1982-2000) and Generation Z (2001-TBD). These expectations and issues span a variety of areas including recruiting, leadership style, communications, motivation, feedback and rewards, workplace flexibility, pay and benefits, and experience.6
Finally, employers in the Twin Cities metro area should contemplate strategies for hiring workers with less educational attainment. Despite the region’s being known for its higher concentrations of employment in business and financial operations, information technology, architecture and engineering, and management — all occupational groups which typically require higher education — only 36 percent of current vacancies require post-secondary education.7 In fact, nearly 30 percent of current vacancies do not require any educational attainment at all. Yet, of the Minneapolis-St. Paul MSA population with less than a high school education, the unemployment rate is twice that of the total labor force (see Figure 3). With that in mind, those industries where a higher percentage of jobs do not require any educational attainment should contemplate new strategies to capture and retain these potential workers. Such strategies may include providing basic skills training, coaching and mentoring, management development, job rotation, internal promotion systems that focus on employee merit, and other methods to improve employee development, motivation, and productivity.8

The 50 by 30 Initiative in Scott County is just one of many local efforts in the Twin Cities Metro Area to promote growth despite the region’s tight labor market. Overall, the initiative envisions that “Scott County residents are stable, connected, educated, and contributing.”9 This includes residents with disabilities, youth and young adults, and those with less educational attainment. In an effort to help such populations, the 50 by 30 Initiative has adopted a four-pillar approach, including housing, workforce, education, and transportation. “By taking an integrated approach to working in the areas of housing, transportation, workforce readiness, and educational preparedness, [the initiative hopes] to gain a comprehensive understanding of current programs, services, initiatives, and investments surrounding these issues,” while developing action plans that address these issues as a system rather than as isolated problems.
Focusing in on workforce readiness, the 50 by 30 Initiative’s aim is comprehensive:
With multiple stakeholders involved, strategies developed to meet these goals include gathering appropriate data on the local economy, improving communication between employers and job-seekers, promoting K12 and post-secondary partnerships with local employers, reaching out to area workforce and job-placement centers, and educating students and parents on career pathway options.
Approaching eight full years of employment expansion, the Minneapolis-St. Paul MSA is showing no major signs of impending recession. Yet future growth may be checked by a number of factors, ranging from a low supply of available workers to an aging labor force. To counter these symptoms of a tight labor market, employers will need to adopt creative strategies for capturing and retaining valuable employees. Many of these strategies can be fairly straightforward, such as bolstering recruitment of those with disabilities, youth and young adults, and those with less educational attainment. As the 50 by 30 Initiative shows, however, creative solutions in this tight labor market will require a hard look at employment, education, housing, and transportation.
1“Demographic Considerations for Long-Range & Strategic Planning.”, Minnesota State Demographic Center, Mar. 2016.
2According to the Bureau of Labor Statistics, the labor force participation rate is the percentage of the population that is either employed or unemployed, that is, either working or actively seeking work.
3“Employment Status: 2011-2015 American Community Survey 5-Year Estimates.” American Fact Finder, U.S. Census Bureau.
4Why Hiring People with Disabilities is Good for Business, Minnesota Department of Employment and Economic Development.
5Rohrer, Amanda. “Youth Summer Employment.” Minnesota Employment Review, Minnesota Department of Employment and Economic Development, March 2017.
6For further reading on Millennial growth in the labor force: Bodin, Chet. “Minnesota’s Millennial Mobility.” Minnesota Employment Review, Minnesota Department of Employment and Economic Development, December 2016
7Source: DEED, Job Vacancy Survey, Q4 2016 results
8Huselid, Mark A. “The Impact of Human Resource Management Practices on Turnover, Productivity, and Corporate Financial Performance.” Academy of Management, vol. 38, no. 3, June 1995, pp. 635-72.
9The 50 by 30 Initiative was named by the Scott County Association for Leadership and Efficiency (SCALE) with the goal of employing 50 percent of the county’s labor force within the county itself by 2030.