by Erik White
January 2020
According to the North American Industry Classification System (NAICS), industries in the Merchant Wholesalers, Durable Goods sector sell capital or durable goods to other businesses. Merchant wholesalers generally take title to the goods that they sell; in other words, they buy and sell goods on their own account and the durable goods are new or used items generally with a normal life expectancy of three years or more. Types of merchant wholesalers of durable goods include: motor vehicle and motor parts, furniture and home furnishing, lumber and other construction materials, professional and commercial equipment and supplies, metal and minerals, electrical and electronic goods, hardware, plumbing and heating equipment and supplies, machinery, equipment, and supplies and miscellaneous durable goods.
Unlike the wholesale trade sector, the Merchant Wholesalers, Durable Goods sector has gained jobs over the past year and five years with an increase of 1,209 jobs in the past year and an additional 10,209 jobs or a 15.7 percent increase in employment over the past five years. The only subsector of the Merchant Wholesalers, Durable Goods sector to see a decrease in employment over the past five years is motor vehicle and motor vehicle parts and supplies which had a decrease of nearly 5 percent in employment with the loss of 376 jobs.
On the other hand, professional and commercial equipment and supplies has increased employment by 30.6 percent with the addition of 4,070 jobs in the past five years and hardware, and plumbing and heating equipment and supplies has grown by nearly 27 percent with an increase of 1,153 jobs in the state. Over the past year electrical and electronic goods subsector of Merchant Wholesalers has grown by 7.2 percent as employment has increased by 689 jobs, behind only the growth of the professional and commercial equipment and supplies subsector in the past year (Table 1).
| NAICS | Industry | Qtr. 2 2019 | Qtr. 2 2018-Qtr. 2 2019 | Qtr. 2 2014-Qtr.2 2019 | |||
|---|---|---|---|---|---|---|---|
| Number of Firms | Number of Jobs | Numeric Change | Percent Change | Numeric Change | Percent Change | ||
| 0 | Total, All Industries | 181,857 | 2,918,102 | 24,234 | 0.8% | 172,103 | 6.3% |
| 42 | Wholesale Trade | 14,062 | 128,988 | -2,613 | -2.0% | -3,662 | -2.8% |
| 423 | Merchant Wholesalers, Durable Goods | 7,389 | 75,211 | 1,209 | 1.6% | 10,209 | 15.7% |
| 4231 | Motor Vehicle and Motor Vehicle Parts and Supplies | 596 | 7,321 | -852 | -10.4% | -376 | -4.9% |
| 4232 | Furniture and Home Furnishing | 251 | 1,965 | 20 | 1.0% | 385 | 24.4% |
| 4233 | Lumber and Other Construction Materials | 460 | 5,295 | -254 | -4.6% | 702 | 15.3% |
| 4234 | Professional and Commercial Equipment and Supplies | 1,536 | 17,358 | 1,263 | 7.8% | 4,070 | 30.6% |
| 4235 | Metal and Mineral (except Petroleum) | 262 | 2,481 | -44 | -1.7% | 96 | 4.0% |
| 4236 | Electrical and Electronic Goods | 819 | 10,291 | 689 | 7.2% | 1,869 | 22.2% |
| 4237 | Hardware, and Plumbing and Heating Equip. and Supplies | 477 | 5,440 | 111 | 2.1% | 1,153 | 26.9% |
| 4238 | Machinery, Equipment, and Supplies | 1,839 | 18,337 | 398 | 2.2% | 1,201 | 7.0% |
| 4239 | Miscellaneous Durable Goods | 1,149 | 6,721 | -122 | -1.8% | 1,109 | 19.8% |
| Source: DEED's Quarterly Census of Employment and Wages (QCEW) | |||||||
As defined by the North American Industry Classification System (NAICS), industries in the Merchant Wholesalers, Nondurable Goods sector sell nondurable goods to other businesses. Nondurable goods are items generally with a normal life expectancy of less than three years. Nondurable goods merchant wholesale trade establishments are engaged in wholesaling products, such as paper and paper products, chemicals and chemical products, drugs, textiles and textile products, apparel, footwear, groceries, farm products, petroleum and petroleum products, alcoholic beverages, books, magazines, newspapers, flowers and nursery stock, and tobacco products.
In 2019 there were 4,481 establishments in the Merchant Wholesalers, Nondurable Goods industry providing 46,518 jobs in Minnesota. The largest subsector, grocery and related product, employed 14,841 and had 31.9 percent of total employment in the Merchant Wholesalers, Nondurable Goods industry. The next largest subsector, miscellaneous nondurable goods, had 9,915 jobs with more than 1,000 business firms.
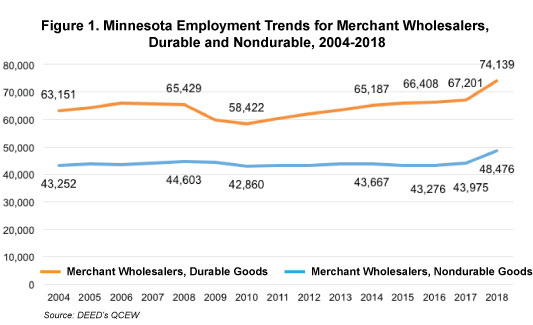
When we compare Merchant Wholesalers, both durable and nondurable, we see there is more employment in durable goods than in nondurable as there are only 48,476 employed in Merchant Wholesalers, Nondurable for the year 2018, compared to 74,139 employees in merchant wholesalers, durable goods. The wholesaling of nondurable goods in Minnesota has had a consistent employment trend going back to 2004, with a slight decrease in employment with the 2008-2009 recession and a substantial increase in employment from 2017 to 2018. Interestingly, this employment trend of slight decreases caused by the recession and recent increases can be found in Merchant Wholesalers of Durable Goods, too (Figure 1).

The Mining Industry has played a pivotal role in Northeast Minnesota's economy since the discovery of iron ore in the Mesabi Range at the start of the 20th century and continues to support the region. New mining projects are being proposed with the excavation of different minerals in the area. While these new projects have yet to be fully approved, iron ore mining remains a staple of the economy with its significant cultural presence and its offering of high-paying jobs.
In 2019 there were 5,814 jobs attributed to the Mining Industry in Minnesota, with the vast majority located in Northeast Minnesota. While making up only 0.2 percent of all jobs in the state, the Mining Industry offers high-paying jobs with the average annual wage eclipsing $87,000, nearly $30,000 more than the average job in the state's economy. The majority of employment in the Mining Industry is part of the metal ore mining subsector where wages are even higher as they reach $95,000. The majority of firms, however, are found in nonmetallic mineral mining and quarrying.
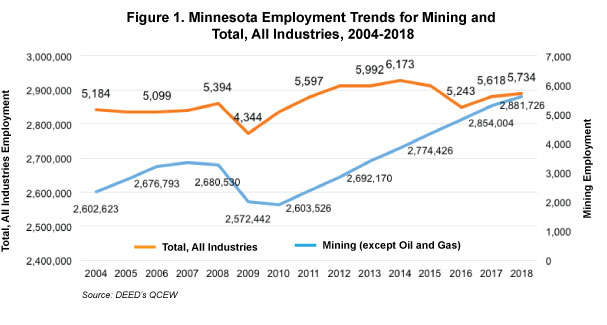
The employment trend for the Mining Industry follows that of the overall economy in that employment dropped from the 2008-2009 recession. Where it differs is that mining had a second set back in 2016 when employment dropped as mines slowed down or shuttered in response to low worldwide steel prices. Since then, employment has rebounded slightly as mines reopened, and employment increased by nearly 500 jobs. However, employment in the sector remains below peak employment, 6,173 jobs, achieved in 2014 (Figure 1).

While we've shown the high-paying nature of the jobs related to the Mining Industry, the type of jobs needed in the industry include: operating engineers, heavy and tractor trailer truck drivers, continuous mining machine operators, excavating operators, mobile heavy equipment mechanics, industrial machinery mechanics, maintenance and repair workers, and electricians. Many of these jobs can be accessed with a high school diploma and post-secondary certificates and pay more in this industry than they do for other industries.
In 2019 1,139 firms were classified as Miscellaneous Manufacturing, with 26,262 jobs statewide. This sector provided over $437 million in payroll for the second quarter of 2019, and the average annual wage for Miscellaneous Manufacturing is similar to the average annual wages of the overall Manufacturing sector. Medical equipment and supplies manufacturing employment makes up two-thirds of total employment in the subsector, and wages are greater for this particular subsector as average annual wages reached nearly $73,500 (Table 1).
| NAICS | Industry | Number
of Jobs |
Number
of Firms |
Total Payroll | Average Annual Wages |
|---|---|---|---|---|---|
| 31 | Manufacturing | 323,977 | 8,233 | $5,315,402,339 | $65,624 |
| 339 | Miscellaneous Manufacturing | 26,262 | 1,139 | $437,672,654 | $66,612 |
| 3391 | Medical Equipment and Supplies Manufacturing | 17,393 | 399 | $319,711,787 | $73,476 |
| 3399 | Other Miscellaneous Manufacturing | 8,868 | 740 | $117,960,867 | $53,196 |
| Source: DEED's Quarterly Census of Employment and Wages (QCEW) | |||||
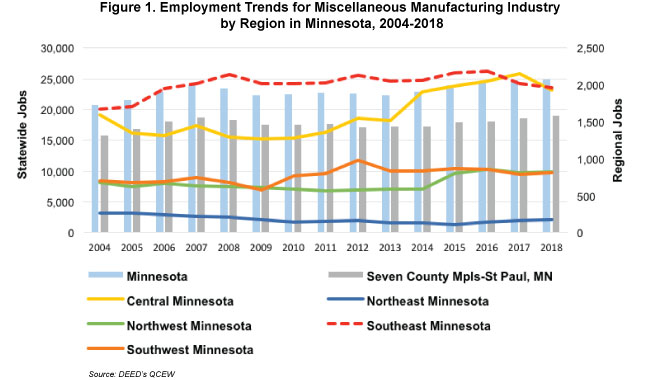
The Miscellaneous Manufacturing sector has increased employment by 1,977 jobs in the past five years statewide, an 8.6 percent increase. Much of the employment in the sector, however, is found in the Twin-Cities Metro area as over 75 percent of the jobs are located there. Regionally, Central and Southeast Minnesota have the most employment in Miscellaneous Manufacturing with nearly 2,000 jobs respectively. Employment is much less in the Northwest and Southwest, with the least amount of employment located in the Northeast portion of the state which had only 179 jobs located there (Figure 1).
