by Dave Senf
December 2018
Note: All data except for Minnesota’s PMI have been seasonally adjusted. See the feature article in the Minnesota Employment Review, May 2010, for more information on the Minnesota Index.
The Minnesota Leading Index and Adjusted Residential Building Permits for November were not available because of the partial federal government shutdown.
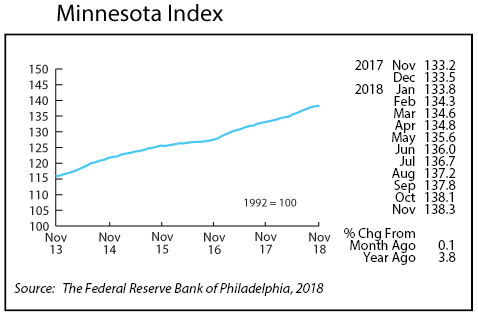
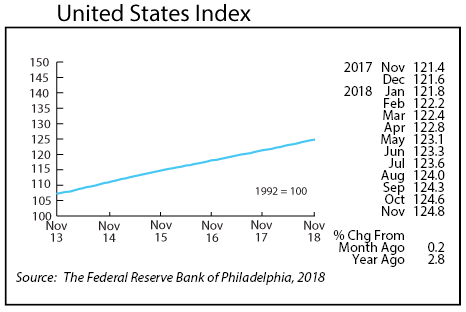
The Minnesota Index advanced for the 27th straight month in November, but the rate of growth slowed compared to earlier in the year. The index jumped an average 0.4 percent each month from May to September but increased only 0.1 percent in November. Waning wage and salary employment growth, declining average weekly manufacturing hours, and three consecutive months with no change in the unemployment rate combined to slow the index.
The 0.1 gain in the state’s index ranked Minnesota 33rd among states between Rhode Island and Arizona. Minnesota’s index for the second month in a row and for only the third time this year increased slower than the U.S. index, which climbed 0.2 percent in November. The over-the-year increase was 3.8 percent for the Minnesota index compared to 2.8 percent for the U.S. Index. This indicates that the Minnesota economy expanded faster than the national economy between November 2017 and 2018.
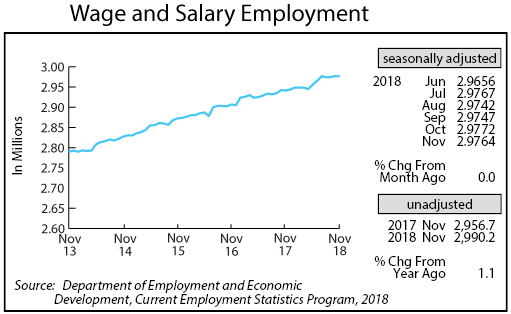
Minnesota’s adjusted Wage and Salary Employment dipped slightly in November as payroll numbers fell by 800 jobs. Job growth has averaged 2,970 for the first 11 months of 2018. On a seasonally adjusted basis employment in the state has increased 32,700 through November, using December 2017 as the starting point.
Job loss was split evenly between the private and public sectors with job cutbacks of 400 in each sector. Job loss was heaviest in Educational and Health Service and in Other Services. Payrolls expanded the most in Leisure and Hospitality and in Professional and Business Service.
Minnesota’s unadjusted over-the-year job growth slipped again in November to 1.1 percent. The 1.1 percent increase, however, translates into 32,700 new jobs over the year. U.S. over-the-year job growth dipped slight to 1.6 percent the slowest pace since July.
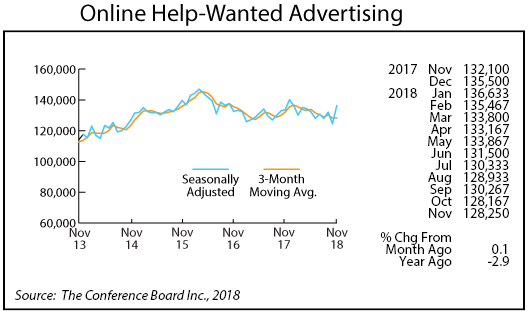
Online Help-Wanted Ads spiked in November to 136,300, the highest level since last December. Minnesota’s jump in job postings was 9.5 percent while U.S. job postings rose 12.3 percent. Minnesota’s share of nationwide online help-wanted ads was 2.7 percent in November. That is the lowest level since May 2017 but still sustainably above the state’s 2.0 percent share of nationwide wage and salary employment.
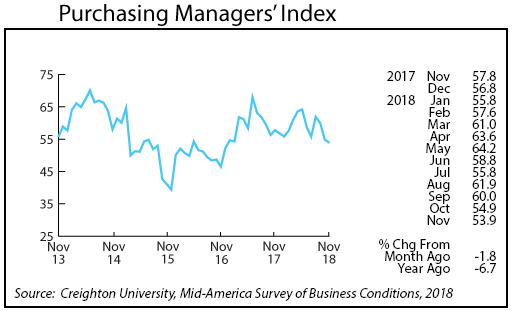
Minnesota’s Purchasing Managers’ Index (PMI) tailed off for the third month in a row and for the fifth time in the last six months in November. The 53.9 reading was the lowest since December 2016. The comparable national index rose in November to 59.3 while the Mid-America Economic Index retreated to 54.9. The Minnesota index suggests that manufacturing activity in the state, while still expanding, has lost some momentum over the last few months.
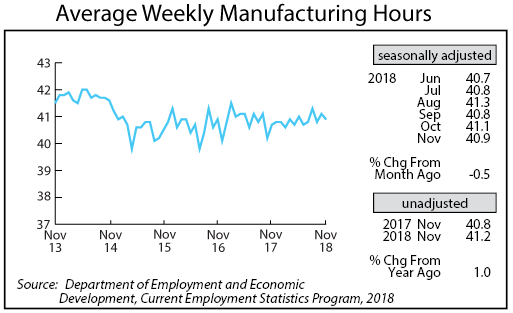
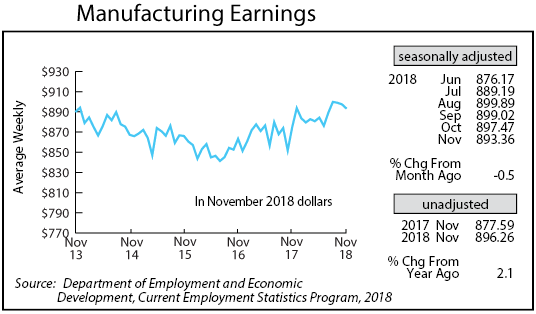
Adjusted average weekly Manufacturing Hours zigzagged down in November, declining to 40.9. The annual average factory workweek through November for 2018 is 40.8 hours per week. That is down slightly from the 40.9 hours in 2017. Average weekly Manufacturing Earnings adjusted for inflation and seasonality slipped for the third straight month to $893.36. Annual average manufacturing earnings through November have averaged $887.30. That is up 1.8 percent in real terms from the $871.32 annual average in 2017.
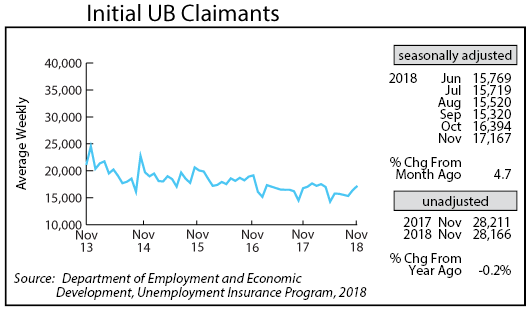
Adjusted Initial Claims for Unemployment Benefits (UB) rose for the second straight month in November, climbing to 17,167. November claims were the highest since March. Initial claims levels remain well below historical averages especially when compared to total wage and salary employment. On average there have been 99 initial claims for every 10,000 wage and salary jobs since 1970. In November there were 58 initial claims per 10,000 wage and salary jobs or nearly half the long-term average level.