Luke Greiner
July 2021
When it comes to employment data it doesn’t get any better than Quarterly Census of Employment and Wages, or QCEW. Known in econ circles as the “gold standard” for detailed employment statistics, QCEW suffers from a roughly 6-month lag before quarterly data can be published. However, the result is fantastically accurate data that can help various organizations better understand what’s going on in their local economy.
With first quarter 2021 data out we can compare the final pre-pandemic quarter to the most recent quarter available. Because of seasonal employment changes, it’s best to compare similar quarters or, better, yet use annual data.
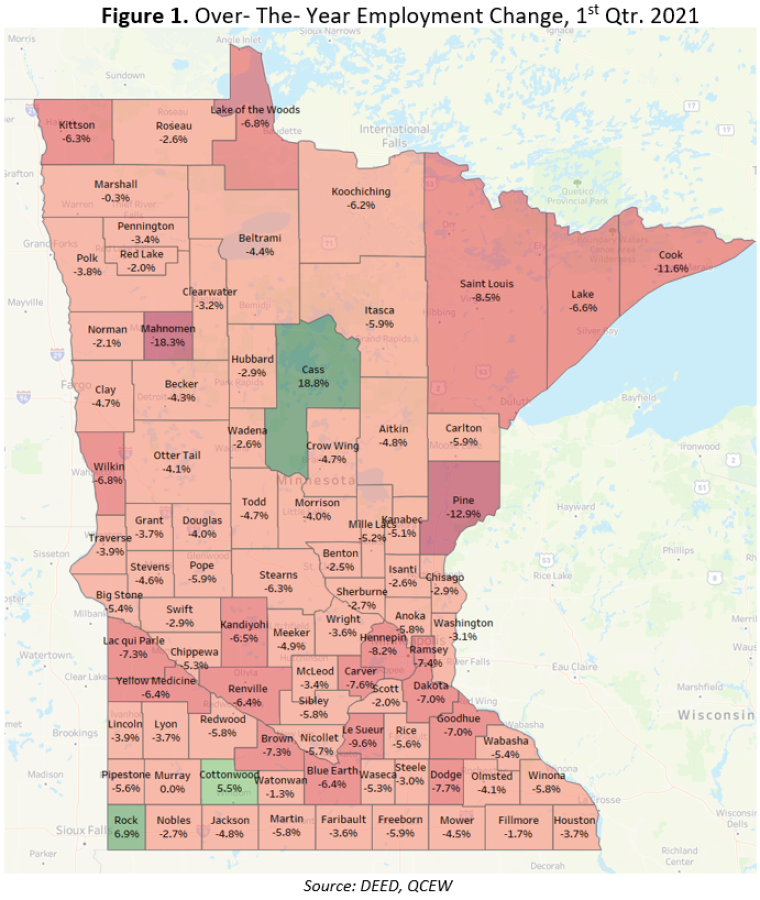
From the first quarter of 2020 to the first quarter of 2021 Minnesota’s employment fell by 171,880 jobs, an astonishing 6% decline. Northeast Minnesota and the Twin Cities shed the highest share of jobs at -7.8% and -7.3% respectively, while the other regions in Greater Minnesota held job losses less than 5%. Looking further into county differences shows stark variations in how the pandemic recession’s impact was unevenly distributed across the state. Mahnomen, Pine, and Cook County all suffered employment losses of more than 10% while Cass, Cottonwood, and Rock counties managed to expand employment from the first quarter of 2020 to the first quarter of 2021.
Cass County is a clear outlier in Figure 1, with the largest change in employment but also in the positive direction. Not immune to the effects of the pandemic, Cass County shed 27.2% of Accommodation and Food Services jobs, but losses were more than offset by huge gains in Construction (2,366 jobs) and to a lesser extent Manufacturing (64 jobs). The incredible construction employment gain in Cass County is largely the result of a large construction project in the region. Meanwhile, Cottonwood and Rock County saw gains in Manufacturing large enough to offset losses elsewhere.
