
by Alessia Leibert
December 2015
Getting a post-secondary degree helps people find better-paying jobs, but race and gender are factors in how much they earn.
The Great Recession marked a transformation in student demographics. Job losses, combined with a slack labor market that allowed employers to increase minimum job requirements, pushed some people to seek retraining who might otherwise not have chosen to attend college. Among these "nontraditional students" were people who enrolled in college over the age of 30 or were first-generation college students.
One important result of this push toward enrollment was an increase in racial diversity in the classroom. The share of blacks who enrolled in a post-secondary institution in Minnesota grew from 5.9 percent in school year 2007 to 14 percent in school year 2013, while the share of Latinos grew from 2 percent to 4.2 percent. The share of white students, on the other hand, dropped from 85 percent to 73 percent over the period.
Despite the narrowing of racial gaps in college enrollments, racial disparities are evident when it comes to completing college. Table 1 describes the racial profile of post-secondary graduates between 2011 and 2013, and breaks down these graduates by educational level. More than 60 percent of white and Asian students obtained a bachelor's degree or higher as their terminal degree, while only 46 percent of blacks and American Indians and 51 percent of Latinos received a BA or higher.
| Table 1: Post-secondary Completers by Race, Graduation Years 2011-2013* | |||||||
|---|---|---|---|---|---|---|---|
| White | Asian | Black/African American | Hispanic/Latino | American Indian or Alaska Native | Other* | Race not reported | |
| All Graduates (percent) | 82.2% | 4.2% | 5.1% | 2.7% | 0.7% | 2.1% | 3.0% |
| All Graduates (number) | 177,090 | 9,072 | 10,907 | 5,886 | 1,597 | 4,506 | 6,358 |
| Distribution Across Education Level by Race | |||||||
| Certificates, Less Than One Year | 3.4% | 3.6% | 11.0% | 7.4% | 11.9% | 6.0% | 3.1% |
| Awards of One to Three Years in Length (Including Certificates and Associate Degree) | 36.1% | 33.7% | 42.6% | 41.6% | 43.3% | 45.7% | 28.8% |
| Bachelor's Degree | 42.7% | 44.4% | 32.0% | 37.0% | 29.8% | 36.5% | 25.9% |
| Graduate Degrees and Certificates | 17.7% | 18.2% | 14.4% | 14.0% | 15.0% | 9.3% | 42.3% |
| 100% | 100% | 100% | 100% | 100% | 100% | 100% | |
| *Includes Native Hawaiian or Other Pacific Islander and Two or More races. Source: DEED, Workforce Data Quality Initiative (WDQI) |
|||||||
This article explores a variety of educational outcomes in the context of racial disparity research, including the following questions:
This study uses administrative data compiled and linked under the Workforce Data Quality Initiative (WDQI) of the U.S. Department of Labor for the purposes of research and evaluation. See the "About the Data" sidebar for more details.
The sources for all data in this article are DEED unemployment insurance wage records and Minnesota Office of Higher Education post-secondary graduation records. Graduates who earned more than one degree were classified according to the highest degree obtained. All post-secondary institutions in Minnesota are represented in these data.
Combining three academic years, from July 2010 to June 2013, allows greater reliability in reporting while at the same time maintaining confidentiality. Wage data throughout the article have been adjusted for inflation based on the federal Consumer Price Index, with the purpose of allowing comparisons over time.
In parts of this analysis, some racial groups are rolled together in order to preserve data confidentiality and to have enough data points to present reliable findings.
Racial disparities in educational outcomes are particularly hard to measure because they often interact with socio-economic factors such as family income, family educational background and quality of prior schooling. Disparities in the labor market can manifest themselves in the form of wages, earnings, employment and the risk of unemployment. This article focuses on wages and industry of employment.
In order to compare wage outcomes by race, we will look only at people who are similar in every way except race. We will use three criteria to isolate the effect of race.
First, we include only the pool of people who were in the labor market three years before graduation and again two years after graduation. Looking at wages before and after, rather than only after graduation, helps identify wage disparities that pre-date school enrollment and influence long-term earnings outcomes.
Second, we look separately at completers of bachelor's degrees versus sub-baccalaureate programs of one to three years, including associate degrees. We expect different market values for different award levels.
Third, we divide the group by age: those who completed between the ages of 21 and 30 and between the ages of 31 and 45. We expect older students to have higher wages after graduation because they had more time to accumulate work experience.
Figure 1 shows findings for graduates between the ages of 21 and 30 who completed a degree of one to three years. Even when controlling for age and degree, wage differences by race are observed. Among sub-baccalaureate graduates between 21 and 30 years old, blacks had higher median wages three years before graduation relative to other races, but their wage advantage did not persist after graduation.
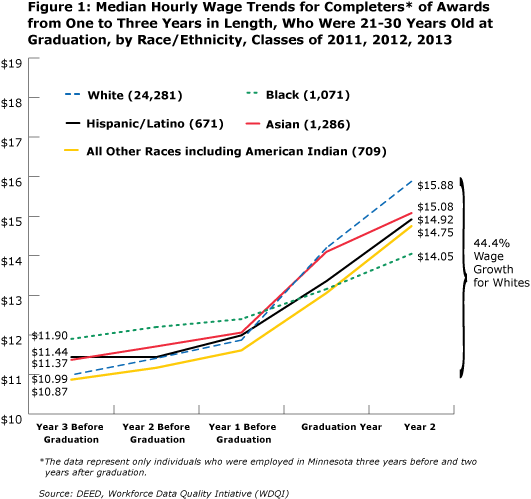
Higher initial wages among blacks might be partially explained by the older age at graduation, which allowed them to spend more time in the labor market. The average graduation age of this group was 25 among blacks and 24 for all other races. The difference is bigger when we look at all completers in this award category rather than just those who were 21 to 30 years old. Average age of completion for blacks was 31 compared to 28 for whites and Latinos and 27 for Asians.
Wages after program completion grew at different rates within racial groups. Over a six-year period that extended two years after graduation, wages grew 44 percent for whites, 36 percent for the "all other races" category (which includes Native Americans and those who reported two or more races), 33 percent for Asians, 30 percent for Latinos and only 18 percent for blacks.
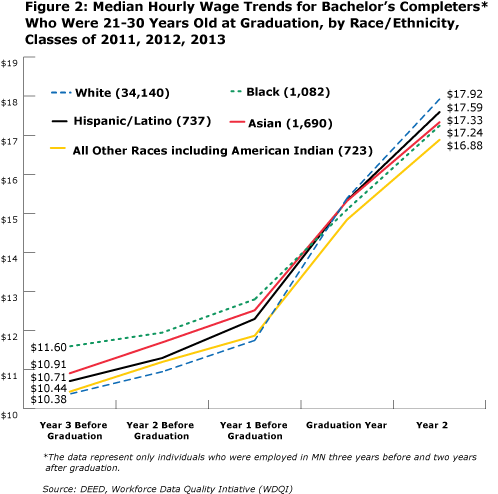
Figure 2 shows findings for bachelor's degree completers between ages 21 and 30. Much like we saw for sub-baccalaureate completers, wages among whites started lower but quickly surpassed others at graduation, growing 73 percent in six years, from $10.38 to $17.92. Wages for blacks grew from $11.60 to $17.24 per hour (up 49 percent). Other wage increases were 62 percent for all other races, 64 percent for Latinos and 59 percent for Asians.
As we look at an older age cohort (31 to 45 years old), we must consider that these people have had more time and experience in the labor force than their younger counterparts. This may well mean that wage disparities have had more time to accumulate, partly because of different employment participation patterns and work experience characteristics, which can be both gender and race related. For example, women might spend less time in the labor market than men due to competing family responsibilities, and this phenomenon might be more pronounced in some race groups than in others. Therefore we'll present findings for men and women separately.
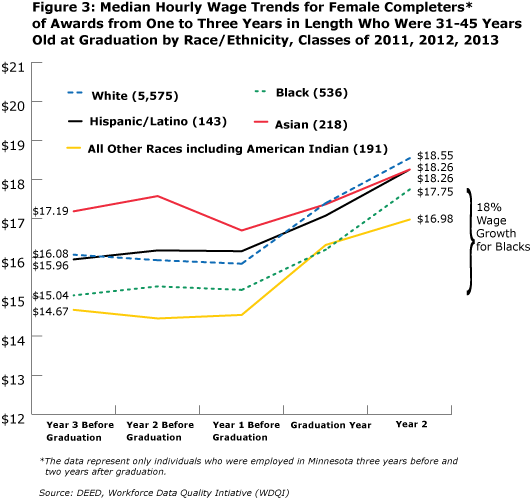
Unlike younger program completers, wage trajectories for older workers before graduation tended to be flat or even declining, possibly because some enrolled in school to retrain after a job loss or moved into part-time, lower-paying jobs to attend school. Among female completers (see Figure 3), Asians, whites and Latinos had higher starting wages than blacks and all other races, and they maintained that advantage after graduation. Black women experienced the largest wage increase (18 percent) relative to their starting wage levels. But while credential attainment helped reduce the initial wage gap, it was not enough to eliminate it.
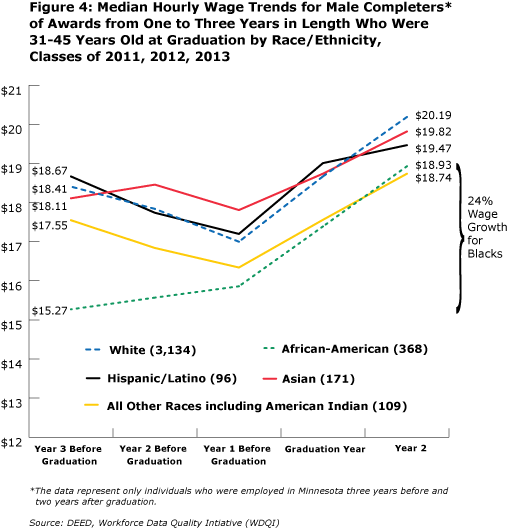
Similar results are found among the older male cohorts, as shown in Figure 4. Black men had a significant wage disadvantage three years prior to graduation, but completion of a post-secondary degree of one to three years gave a substantial boost of 24 percent to wages among black men, compared with 9.7 percent among whites, 9.5 percent among Asians, 4.3 percent among Latinos and 6.8 percent among other races.
The difference in median wages between white and black men dropped from $3.14 three years before graduation to $1.26 two years after graduation. Black men started with wages that were 17 percent below those of whites and ended with wages that were 6.3 percent below those of whites. The disparity still existed but was reduced by completion of a sub-baccalaureate degree.
Industry of employment indicates the skill level of a job and the opportunity for career advancement for post-secondary graduates. Although the top industries of employment for graduates of one- to three-year programs are the same across race groups – hospitals, offices of physicians and dentists, temp help agencies, restaurants, nursing care facilities, and residential mental health facilities – we see differences in the proportion of graduates by race employed within each.
As illustrated in Figure 5, white graduates tend to be more highly represented in high-skill, high-pay industries such as professional and technical services (5.2 percent), offices of physicians and dentists (6.7 percent), manufacturing (7.2 percent), hospitals (almost 10 percent) and construction (4.9 percent). Asians are also highly concentrated in manufacturing (12.6 percent) and offices of physicians and dentist (9.1 percent).
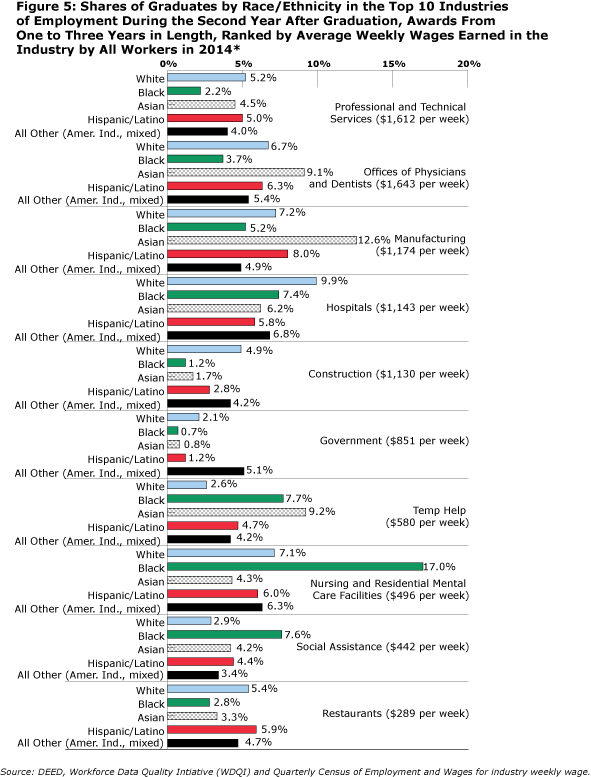
On the other hand, black completers are extremely concentrated in nursing and residential care facilities (17 percent), where skill and pay levels are lower compared with hospitals and offices of physicians, and in social assistance (7.6 percent), where wages are lower than in health care. Latino graduates are spread out across many of the same industries as whites, but are uniquely concentrated in restaurants (5.9 percent). The category all other races, which includes American Indians and people of more than one race, are uniquely concentrated in government (5.1 percent) reflecting American Indian employment in tribal government and particularly at tribal casinos.
The industry where whites are least represented is temp help, which employs 9.2 percent of Asian, 7.7 percent of black, 4.7 percent of Latino, 4.2 percent all other and only 2.6 percent of white graduates. This industry primarily offers temporary job opportunities that rarely translate into a continuous career path. Surprisingly, this industry also has a high concentration of racial minorities who earned a bachelor's degree. It is impossible to know from these data whether employment in this industry was a voluntary choice or an example of underemployment. The prevalence, however, of part-time employment and the relatively low wages in this industry signal difficulty finding stable employment that rewards academic skills and knowledge.
We demonstrated that racial wage disparities develop before age 30. Do they exist even for cohorts who majored in the same field? Are some educational pathways more successful than others at minimizing racial disparities in wages?
For the sake of simplicity, we'll limit the analysis to people who graduated between ages 21 and 30, belong to one of the largest race groups and majored in fields with a large number of graduates. Table 2 displays the breakdown of graduates by major and race, including median wages during the second year after graduation by gender.
| Table 2: Earnings by Demographic Characteristics of Completers, Awards from One to Three Years in Length, Ages 21 to 30 at Graduation, by Selected Fields of Study | ||||
|---|---|---|---|---|
| Majors | Race | Share of Completers by Major and Race | Median Wages, Females | Median Wages, Males |
| Health Care | White | 28.0% | $18.28 | $20.95 |
| Black | 29.1% | $17.22 | $20.90 | |
| Asian | 26.7% | $16.73 | $16.14 | |
| Liberal Arts | White | 21.2% | $12.97 | $12.75 |
| Black | 25.0% | $12.82 | $12.27 | |
| Asian | 26.5% | $12.60 | $12.85 | |
| Personal and Culinary Services (Culinary Arts and Cosmetology) | White | 4.8% | $11.99 | $12.20 |
| Black | 14.7% | $11.07 | $11.88 | |
| Asian | 5.9% | $11.35 | $13.18 | |
| Engineering and Engineering Technologies | White | 3.7% | $16.18 | $18.81 |
| Black | 1.4% | Suppressed - Only one individual | $15.62 | |
| Asian | 2.9% | $18.95 | $16.60 | |
| Construction | White | 3.8% | $17.65 | $18.82 |
| Black | 1.4% | No Graduates | $15.21 | |
| Asian | 1.6% | Suppressed - Only two individuals | $17.10 | |
| Mechanic and Repair Technologies/Technicians | White | 5.1% | $13.22 | $15.99 |
| Black | 2.3% | No Graduates | $13.71 | |
| Asian | 3.5% | Suppressed - Only one individual | $13.75 | |
| Business | White | 8.8% | $14.88 | $16.19 |
| Black | 6.7% | $13.51 | $14.30 | |
| Asian | 9.1% | $16.10 | $14.54 | |
| IT | White | 3.4% | $15.76 | $17.72 |
| Black | 2.5% | Suppressed - Only one individual | $16.60 | |
| Asian | 5.2% | $13.74 | $16.03 | |
| All Majors | White | 100.0% | $15.38 | $16.06 |
| Black | 100.0% | $13.44 | $13.93 | |
| Asian | 100.0% | $14.77 | $14.66 | |
| Source: DEED, Workforce Data Quality Initiative (WDQI) | ||||
We observe that, even after correcting for age of completion, education level, major and graduation period, there is still evidence of race- and gender-related differences in earnings. As early as two years after graduation men were earning more than women, with Asian women being the exception, and whites were earning consistently more than blacks. Earnings for Asians typically ranked in the middle between whites and blacks.
First we notice disparities in college major selection by race. Whites are under-represented in personal and culinary services and liberal arts and over-represented in engineering and business-related majors, which tend to lead to jobs in higher-paying careers. Across majors, the median earnings of black ($13.93) and Asian men ($14.66) were 87.7 and 91.3 percent, respectively, of the earnings of white men ($16.06). If graduates were more equally represented across majors, we might see fewer differences by race in industries of employment after graduation and thus less wage disparity.
Some factors that impact choice of major are preparation, prior exposure, interests, availability of role models, and perception of hiring practices and workplace acceptance within the sector. Traditionally low representation of women and minorities in some sectors can discourage women and minority students from pursuing degrees in fields where they see little chance of being hired.
Secondly, however, we cannot ignore that two years after graduation wage disparities within the same major are very pronounced, especially among men in fields related to construction or engineering. In engineering, whites earned $18.81 versus blacks at $15.62. In construction, whites earned $18.82 versus blacks at $15.21. In mechanic and repair technologies, whites earned $15.99 versus blacks at $13.71. The sections below explore these within-major disparities.
Table 3 illustrates the effects of industry of employment on wages among men who majored in engineering. Of those who completed a one- to three-year award in engineering from July 2010 to June 2013, only 23 were black and 55 were Asian, while 1,257 were white. Despite the fact that blacks earned more than whites in manufacturing, an industry where engineering majors are in high demand, relatively more whites and Asians found employment in the sector than blacks.
| Table 3: Main Industries of Employment for Male Engineering and Engineering Technologies Graduates, Awards from One to Three Years in Length, Ages 21 to 30 at Graduation | |||
|---|---|---|---|
| Industries of Employment in 2nd Year After Graduation | Race | Percent Employed in the Industry | Median Wage During the Year |
| Manufacturing | White | 32.2% | $20.26 |
| Black | 27.8% | $23.10 | |
| Asian | 36.7% | $18.22 | |
| Professional and Technical Services | White | 12.2% | $19.03 |
| Black | 5.6% | Suppressed - Only one individual | |
| Asian | 16.3% | $16.40 | |
| Construction | White | 7.9% | $19.22 |
| Black | None | None | |
| Asian | 2.0% | Suppressed - Only one individual | |
| Temp Help | White | 6.4% | $17.50 |
| Black | 22.2% | $17.28 | |
| Asian | 20.4% | $14.31 | |
| Total, All Industries | White | 100% | $18.81 |
| Black | 100% | $15.62 | |
| Asian | 100% | $16.60 | |
| Source: DEED, Workforce Data Quality Initiative (WDQI) | |||
Furthermore, blacks were almost absent from professional and technical services, a high-skill industry where white men were employed at $19.03 an hour and Asian men were employed at $16.40 an hour, two years after graduation. Not a single black engineering graduate was employed in the construction industry, while 22.2 percent were employed in temp help. Partially as a consequence of being under-represented in industries where engineering skills are highly rewarded, black engineering graduates overall ended up earning considerably less than whites and Asians.
In general, regardless of race, graduates who find employment in a related industry earn more than those who do not. If some racial groups are less successful than others at breaking into higher-paying industries related to their degree, disparities will inevitably emerge. Wage gaps that begin at the start of a career can accumulate dramatically over a 40-year work life.
Table 4 offers another example. Despite the fact that black men with a degree in business earned more than white men with the same degree in industries such as retail, manufacturing, and finance and insurance, their uniquely high concentration in temp help (15.6 percent) leads to aggregate wage levels that are lower than those of whites and Asians.
| Table 4: Main Industries of Employment for Male Business Graduates, Completers of Awards from One to Three Years in Length, Ages 21 to 30 at Graduation | |||
|---|---|---|---|
| Industries of Employment in Second Year after Graduation | Race | Percent Employed in the Industry | Median Wage During the Year |
| Retail | White | 17.5% | $13.86 |
| Black | 14.6% | $17.69 | |
| Asian | 13.9% | $11.54 | |
| Manufacturing | White | 11.3% | $17.59 |
| Black | 10.4% | $18.75 | |
| Asian | 18.5% | $19.81 | |
| Finance and Insurance | White | 9.2% | $18.26 |
| Black | 6.3% | $19.98 | |
| Asian | 7.7% | $14.77 | |
| Temp Help | White | 4.1% | $14.77 |
| Black | 15.6% | $11.85 | |
| Asian | 10.8% | $13.32 | |
| Total, all industries | White | 100% | $16.18 |
| Black | 100% | $14.30 | |
| Asian | 100% | $14.54 | |
| Source: DEED, Workforce Data Quality Initiative (WDQI) | |||
Despite the unquestionable existence of racial disparities in the labor market, success stories are not completely lacking. As shown in Table 5, black female graduates in registered nursing had highly competitive wages across industries. However, most of them (52.9 percent) found jobs in nursing and residential care facilities compared with 27.9 percent of whites and 20 percent of Asians, while the most prevalent industry for white and Asian graduates was hospitals.
Being under-represented in higher-paying sectors creates a risk of wage disparities as careers mature, because pay rates in nursing and residential care facilities tend to have a lower cap compared with hospitals and ambulatory services. Although wage disparities do not exist at this initial stage, the segregation by industry might later lead to disparities as some industries offer more opportunities for skills development and earnings growth than others.
| Table 5: Main Industries of Employment for Women Who Majored in Registered Nursing, Associate Degree, Ages 21 to 30 at Graduation | |||
|---|---|---|---|
| Industries of Employment in Second Year after Graduation | Race | Percent Employed in the Industry | Median Wage During the Year |
| Hospitals | White | 40.4% | $31.16 |
| Black | 20.0% | $33.48 | |
| Asian | 36.0% | $30.24 | |
| Nursing and Residential Care Facilities | White | 27.9% | $24.94 |
| Black | 52.9% | $26.64 | |
| Asian | 20.0% | $24.82 | |
| Ambulatory Services | White | 21.2% | $26.65 |
| Black | 11.4% | $25.74 | |
| Asian | 28.0% | $26.74 | |
| Total, All Industries | White | 100% | $27.11 |
| Black | 100% | $27.16 | |
| Asian | 100% | $26.56 | |
| Source: DEED, Workforce Data Quality Initiative (WDQI) | |||
The intent of this study is to document racial disparities in labor market returns to post-secondary education and examine how they develop, with the aim of informing policies to address the problem. We found that the economic reward to educational attainment varies by gender and race. Women tend to earn less than men, and most racial minorities, especially blacks, Latinos, and American Indians or mixed race people, tend to earn less than whites after graduation at every level of educational attainment. We find that completion of a college degree does reduce racial wage disparities, but not enough to eliminate them altogether.
A variety of factors help explain post-college wage disparities by race. We presented quantitative evidence on four of these factors.
First, white and Asian students are more likely to major in high earning fields such as engineering, IT, and business, while black students are more represented in low-paying fields such as personal and culinary services (see Table 2). Choice of major strongly determines the payoffs from higher education.
Second, after graduation, racial minorities are more likely to work in lower-wage industries unrelated to their degree (see Figure 5 and Table 3). The high concentration of racial minorities, particularly blacks, in temp help and other low-wage industries explains a large part of the wage disparities by race. It also deprives these graduates of opportunities to advance their careers and wages after graduation and deprives the labor market of fully benefiting from these degrees. Where racial minorities, particularly blacks, were able to find jobs in industries related to their majors, wage disparities essentially disappeared.
Third, there are racial differences in the time of degree completion, with blacks completing later than other racial groups. This means that blacks have fewer years to benefit from that degree.1
Last but not least, for those who graduate after age 30, minorities, particularly blacks, tend to have lower incomes three years before completing school (see Figure 3 and 4). Low income status puts them at a disadvantage in the labor market by impacting how much effort they can dedicate to academics and how selective they can be in their job search after graduation.
As racial minorities make up an increasing share of Minnesota's labor force, it is essential to ensure their full and equitable integration into the economy. Access to career information and counseling before choosing a major is critical to ensuring minority students choose high-demand, high-pay fields where their educational investments are valued. Moreover, job search support is critical to ensuring racial minorities benefit from their education. Job search support could help to insulate against the tendency to end up in temp help and other low-paying industries that do not provide as many opportunities for professional development and career advancement.
Other in-school support services should be geared toward helping racial minorities, and in particular blacks, complete a credential soon after high school so that they can start utilizing marketable skills and building a career at as young an age as possible.
Finally, and of critical importance, the business community must start recruiting and hiring qualified racial minorities, particularly blacks. The skills and knowledge of blacks and other racial minorities are clearly being underutilized in Minnesota's labor market, and employers are one of the groups losing out as a result. A more equal representation across industries would, in turn, encourage more minorities to pursue higher education and in-demand majors, improve their participation in higher-paying fields, and ultimately contribute to the competitiveness of our state's economy.
1For additional information on this topic see the feature article by A. Leibert in Minnesota Employment Review, January 2015, pp.5-7.