by Mark Schultz
December 2021
From an occupational standpoint, Minnesota shares many similarities with its neighboring states, but also some notable differences. According to data from DEED's Labor Market Information office and the Bureau of Labor Statistics, Minnesota and Wisconsin have the two largest economies in the region, nearly identical in size with just over 2.7 million jobs, while Iowa had just over half that many jobs. In contrast, North and South Dakota were the smallest, with both having just over 400,000 jobs.
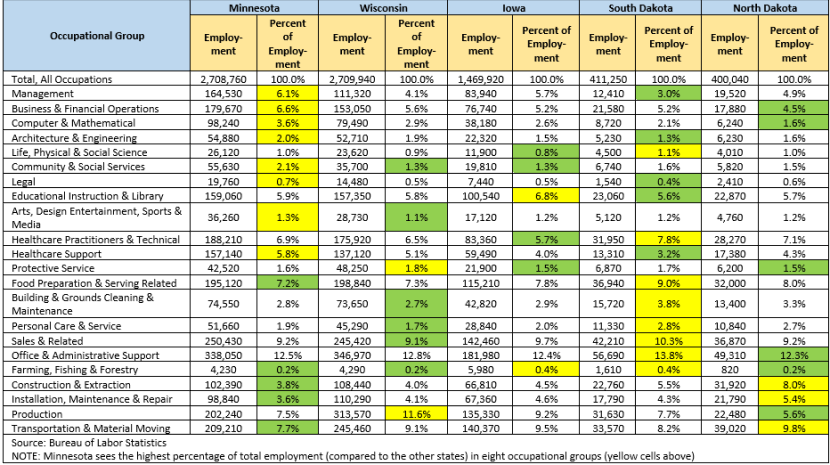
Looking at Occupational Employment & Wage Statistics, minor differences can be seen by analyzing the percent of the total employment each occupational group makes up. For example, Minnesota sees the highest percentage of total employment (compared to the other states) in eight occupational groups (denoted as yellow cells in Table 1), including Management (6.1%), Business & Financial Operations (6.6%), Computer & Mathematical (3.6%), Architecture & Engineering (2.0%), Community & Social Services (2.1%), Legal (0.7%), Arts, Design, Entertainment, Sports & Media (1.3%), and Healthcare Support (5.8%).
On the other hand, Minnesota has the lowest percentage of total employment compared to the bordering states in five occupational groups (green cells in Table 1) – Food Preparation & Serving Related (7.2%), Farming, Fishing & Forestry (which is shared with Wisconsin and North Dakota at 0.2%), Construction & Extraction (3.8%), Installation, Maintenance & Repair (3.6%), and Transportation & Material Moving (7.7%) (see Table 1).
Table 1. Percent of Total Employment Comparisons by Occupational Group and State (May 2020)

When looking at percentage of total employment, however, two similarities appear with Office & Administrative Support occupations making up the largest percentage of the total employment in all five states and Farming, Fishing & Forestry jobs accounting for the lowest percentage. As shown in the next section, Minnesota's occupational mix is advantageous because it has higher percentages of total employment among many of the higher-paying occupational groups, such as Management, Business & Financial Operations, Computer & Mathematical, and Architecture & Engineering, and lower percentages of lower-paying groups including Food Preparation & Serving and Personal Care & Service.
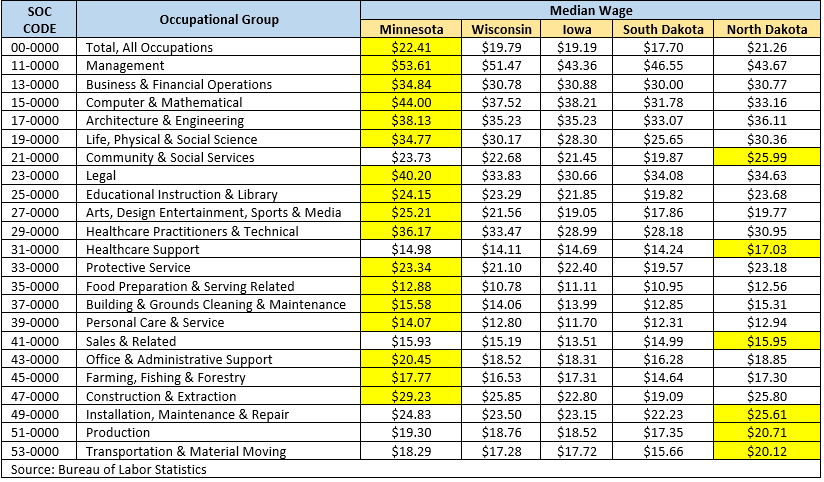
Median wages across all occupations are higher in Minnesota than in bordering states. Minnesota's median wage rested at $22.41 in 2020 for all occupations compared to $21.26 in North Dakota, $19.79 in Wisconsin, $19.19 in Iowa, and $17.70 in South Dakota. The median wages in Minnesota are highest not only across the total of all occupations, but also for 16 of the 22 occupational groups. Interestingly, for those six occupational groups in which Minnesota does not carry the highest median wages, all six see the highest median wages occurring in North Dakota, leaving Wisconsin, Iowa, and South Dakota without the honor of claiming the highest median wage among any of the occupational groups (Table 2).
Table 2. Median Wages by Occupational Group by State (May 2020)

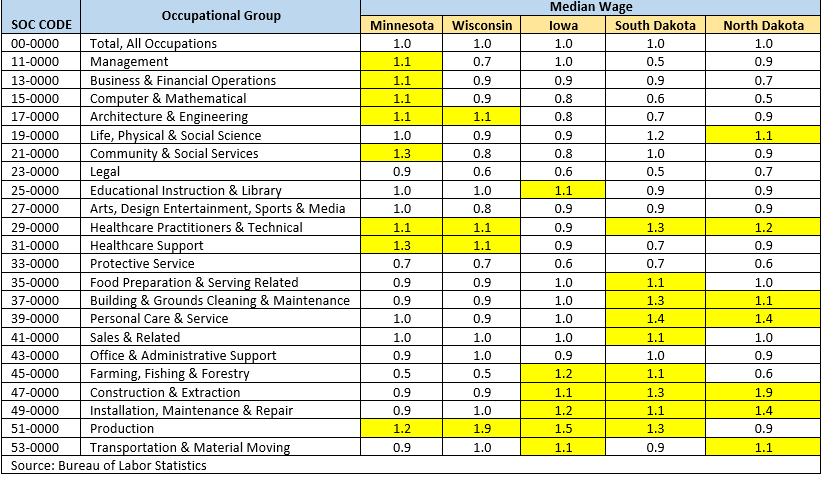
Another way to compare the economies of Minnesota to its neighboring states is to look at location quotients, which gauge the relative concentration of an occupational group in the state compared to the nation, with any LQ over 1.0 showing a higher concentration. As shown in Table 3, there are eight occupational groups that are more highly concentrated in Minnesota than the nation as a whole, including Management (1.1), Business & Financial Operations (1.1), Computer & Mathematical (1.1), Architecture and Engineering (1.1), Healthcare Practitioners & Technical (1.1), Production (1.2), Community & Social Services (1.3), and Healthcare Support (1.3). In comparison, Wisconsin (4), Iowa (6) and North Dakota (7) had fewer occupational groups that showed higher concentrations, while South Dakota eked out one additional group for a total of 9.
As was seen with the employment data above, Minnesota benefited from higher concentrations in some of the higher-paying occupational groups while, for the most part, the other states did not. In addition, four of the five states - including Minnesota - had higher concentrations in Healthcare Practitioners & Technical occupations as well as Production occupations (see Table 3).
Table 3. Location Quotients by Occupational Group by State (May 2020)

In this tight labor market with many employers struggling to find qualified applicants to fill their job openings, job seekers with mobility may ask themselves "What is the appeal to working in Minnesota?" One answer is that Minnesota's median wages are the highest in the region across most occupational groups. This means that in most cases, similarly-skilled workers can earn more working in Minnesota than in surrounding states.
In addition, Minnesota sees higher concentrations of jobs in higher-paying service-providing occupational groups than neighboring states. While Minnesota has long prided itself on being "above average", the concentration of many high-paying occupations and cross-border commuter patterns clearly show that our state remains competitive with our neighbors to the east, west and south, and in many cases, we excel in comparison.