By Oriane Casale
March 2014
The official monthly unemployment rate, known as U3, is just one of the ways to measure national and state unemployment. The Bureau of Labor Statistics has five other unemployment classifications, depending on what criteria are used.
The official unemployment rate is one of a series of six measures of unemployment that the Bureau of Labor Statistics produces for all states using data from the Current Population Survey. This article will define the official unemployment rate and explore the other five measures of unemployment. It will also provide unemployment rates across a diversity of population subgroups.
Broadly defined, unemployment is a measure of the unused and available resources in the labor force. The official unemployment rate, also known as U3, estimates the share of people in the civilian labor force (16 and over) who want to work, are available to work and are actively seeking work. To be actively seeking work, a survey respondent must report employment search activities within the last month, such as contacting employers about current job openings. The official unemployment rate does not include people who aren’t engaged in job-seeking activities even if they want a job.
The official unemployment rate is calculated by dividing the civilian labor force (the civilian, non-institutionalized population age 16 and over) by the number unemployed. As the denominator, the size of the civilian labor force matters:
The total labor force in Minnesota has declined overall since the middle of 2012. It is unclear whether this is temporary or a longer term trend. In any case, the rate of increase has slowed dramatically since the middle of the last decade due to the aging population (think baby boomers). This decline is causing a dramatic drop in the labor force participation rate, or the share of the civilian labor force that is working or looking for work. This slowing of labor force growth (or possible decline) also tends to push down the unemployment rate and cause a tightening of the labor market as employers replace retirees from the ranks of the unemployed.
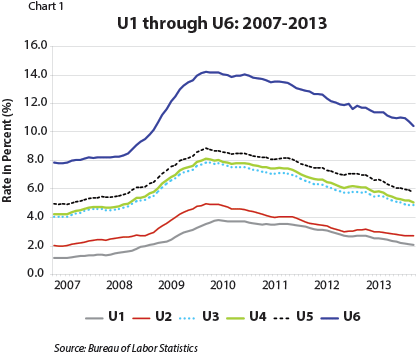
U1 and U2 result in lower rates than U3 because the definitions are even more restrictive in terms of who is counted as unemployed (see Chart 1). U1 is a measure of mid- to long-term unemployment, counting only people unemployed 15 weeks or longer in the numerator. U2 includes only people who have recently lost a job, job losers and people who completed temporary jobs. It does not include people who have never held a job or have been out of the workforce for some time.
The U4 through U6 measures result in higher unemployment rates than U3, as Chart 1 shows.

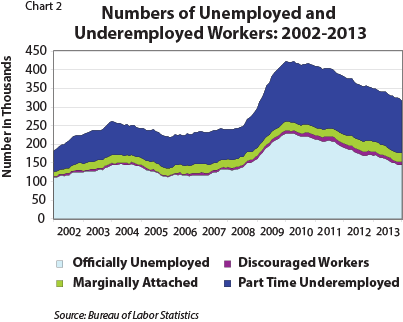
Chart 2 stacks the estimated number of Minnesotans who comprise each category in U3 through U6. As this chart clearly shows, the officially unemployed are the largest group, totaling 144,800 in December 2013, followed closely by the underemployed, those working part time for economic reasons, which totaled 140,400 during the same period. In total, 316,600 workers were unemployed or underemployed in Minnesota during December 2013 by the broadest definition of unemployment.

Monthly unemployment rates for population subgroups are also available from the Current Population Survey. These population subgroups include black, Hispanic and White, male and female, various age groups and various levels of educational attainment. Unemployment rates for other subgroups, including people with disabilities and veterans, are only available through the American Community Survey on an annual basis, not the Current Population Survey. Some cross tabulations (teens by race, for example) are also available monthly.
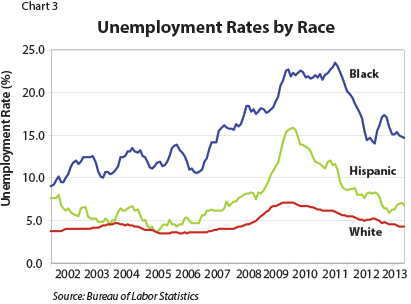
Racial disparities in unemployment have received much attention in Minnesota recently — and for good reason. Chart 3 illustrates the U3 definition by the available race categories: black, Hispanic and white. Blacks were 3-1/2 times more likely to be unemployed than whites in December 2013, with an even larger gap during the recession. Moreover, the downward trend in black unemployment rates started almost two years after that of whites and Hispanics.

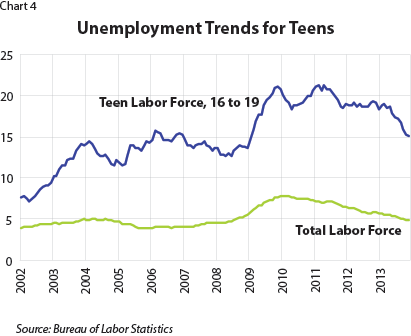
Unemployment rates for teens also are stark, standing at three times the rate of the total labor force. Moreover, rates for this group increased throughout the last decade as Chart 4 illustrates. The downward trend in 2013 shows that they are just now returning to near pre-recession levels.

The official unemployment rate is only one of many different measures of unemployment and underemployment available. This article presents a sample of measures that are available for Minnesota on a monthly basis.
Data and MethodologyAll of the monthly measures presented in this article were produced from data collected by the Bureau of Labor Statistics (BLS) through the Current Population Survey. With a sample size of only 1,700 households in Minnesota, there are not a lot of data with which to produce estimates across a broad range of indicators and for population subgroups. As a result, a fair amount of statistical error is associated with many of the resulting measures. Because of this, BLS publishes only the official unemployment rate (U3) monthly. Although all of the monthly estimates presented here are public and releasable, the BLS publishes unemployment estimates for subgroups annually, in the Geographic Profile of Employment and Unemployment, and U1 through U6 measures quarterly. All of the monthly data published here are presented as a 12-month moving average. In other words, each monthly data point is an average of that month and the previous 11 months of data. Both the BLS and the Minnesota Labor Market Information Office use this method to smooth the series while presenting the trend. |