By Tim O'Neill
June 2018
The unemployment rate is one of the most popular pieces of information that comes out of the Minnesota Department of Employment and Economic Development’s (DEED) Labor Market Information Office. You might hear what the unemployment rate is from your local news station, read all about it in the daily newspaper, or see an official release of such data from DEED and the Bureau of Labor Statistics (BLS). If you are an employer, you are probably keeping an eye on the unemployment rate in different areas to get a sense of where available workers may be. If you are a jobseeker, you may notice more and more opportunities for work as the unemployment rate drops. There are, however, a lot of complexities around the unemployment rate and the labor market in general that a simple number will not reveal. This article will begin to unravel some of these complexities by highlighting what the unemployment rate really is. Special focus will be given to the Seven County Twin Cities Metro Area.1
As of June 2018 the unemployment rate in the Metro Area was 2.8 percent. So what exactly does this mean? To get at this question, you need to understand a few other terms first, including employment, unemployment, and the labor force.
Now that we understand these concepts of the labor market, we can finally turn to the unemployment rate. At its most simple definition, the unemployment rate reflects the number of unemployed people as a percentage of the labor force.
So let’s take a closer look at that 2.8 percent unemployment rate. Broken down, the estimated number of unemployed in the Metro Area was 48,248 in June 2018. At the same time, the region’s total labor force was 1,740,905 people. 48,248 divided by 1,740,905 is equal to 2.8 percent. Voila! The region’s unemployment rate.
Across the Metro Area, unemployment is extremely low. At 2.5 percent, Scott County has the lowest unemployment rate of any metro county, which represents approximately 2,100 unemployed in that county. At 3.0 percent, Ramsey County has the highest unemployment rate in the metro, representing about 8,800 unemployed in that county. 3.0 percent is still very low, however, being significantly lower than the national unemployment rate of 4.2 percent. With about 20,000 unemployed, Hennepin County has the highest number of unemployed of any metro county. With just under 715,000 people in its labor force, however, the county also has a very low unemployment rate, at 2.8 percent. Note, none of these unemployment rates is seasonally adjusted (see Table 1).
| Table 1. Labor Force Statistics in the Metro Area | ||||
|---|---|---|---|---|
| Geography | Labor Force | 2016 Labor Force Participation Rate | Unemployment | Unemployment Rate |
| Anoka County | 199,477 | 72.1% | 5,666 | 2.8% |
| Carver County | 58,608 | 75.6% | 1,534 | 2.6% |
| Dakota County | 244,863 | 74.7% | 6,598 | 2.7% |
| Hennepin County | 714,992 | 71.9% | 19,745 | 2.8% |
| Ramsey County | 294,331 | 68.7% | 8,757 | 3.0% |
| Scott County | 84,073 | 76.8% | 2,132 | 2.5% |
| Washington County | 144,561 | 70.4% | 3,816 | 2.6% |
| Metro Area | 1,740,905 | 71.9% | 48,248 | 2.8% |
| Minnesota | 3,132,913 | 69.5% | 91,369 | 2.9% |
| United States | 163,277,000 | 63.1% | 6,812,000 | 4.2% |
| Source: MN DEED Local Area Unemployment Statistics (LAUS), American Community Survey | ||||
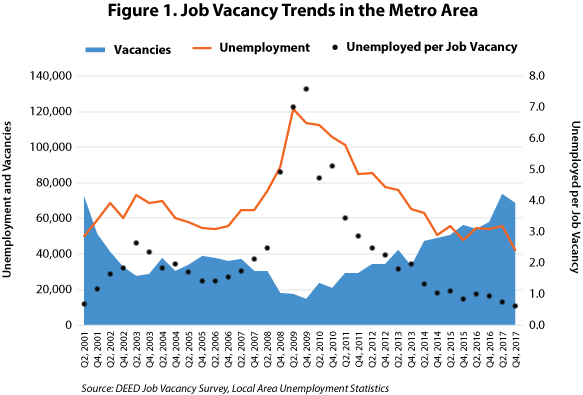
So – the unemployment rate in the Metro Area is at 2.8 percent. As mentioned, this number is extremely low. How low? Other than hovering around 2.7 percent since late 2017, the unemployment rate hasn't been this low in the Metro Area since December, 2000. The total number of unemployed, at just over 48,000, hasn't been this low since May, 2001.
At the other end of the spectrum, the unemployment rate spiked at 8.1 percent in June 2009 during the Great Recession. The total number of unemployed during that time hit nearly 131,000 people.
The number of unemployed, the number of employed, and the corresponding labor force size is in constant motion, heavily swayed by periods of recession and expansion in the labor market. As mentioned in recent labor market articles2, however, the low unemployment rate currently marks uncharted territory for the State of Minnesota and the Twin Cities Metro Area. This can largely be attributed to two things: the continued economic growth at the state and national levels and the aging of the Baby Boomer generation.
This is where labor force participation rates should be considered. As of 2016 the Metro Area had a labor force participation rate of 71.9 percent. Such rates were especially high in Carver and Scott counties, which hit 75.6 percent and 76.8 percent, respectively. All of these rates were significantly higher than the national labor force participation rate of 63.1 percent (see Table 1). Essentially, these high labor force participation rates mean that most people in these counties are working or actively looking for work.
Ultimately, with low unemployment, high labor force participation, and an aging population, employers across the Metro Area, Minnesota, and the United States will be wondering where they can find workers to fill their job vacancies. Even today in the Metro Area there are only about 0.6 unemployed persons for every job vacancy (see Figure 1). It certainly continues to be a tight labor market.

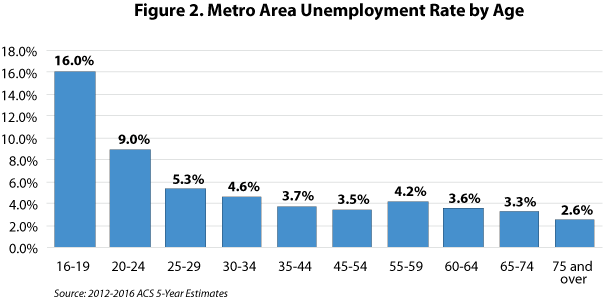
Understanding the overall unemployment rate is vital to analyzing a region's labor market. Going a step further, however, and digging into this statistic for different populations helps create a much more complete picture. For example, unemployment rates can be broken down for different age cohorts. Figure 2 reveals that, as of the 2016 American Community Survey (ACS) 5-Year Estimates, the unemployment rate for teenagers in the Metro Area was 16.0 percent. This was significantly higher than the overall unemployment rate of 5.0 percent at that time. This rate was nearly halved to 9.0 percent for 20 to 24 year olds, before steadily declining through those oldest workers in the labor market (see Figure 2).

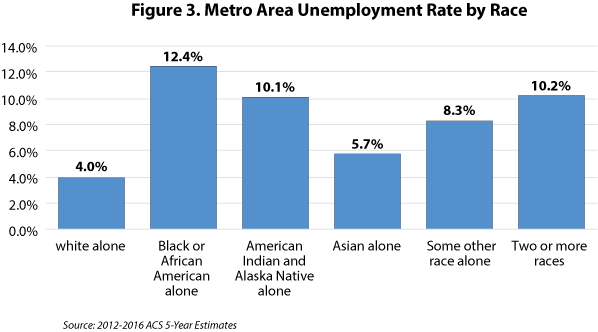
Unemployment rates can also be broken down by race and ethnicity. Analysis of such rates highlights continued employment disparities in the Metro Area, with unemployment rates for Black or African Americans (12.4 percent), American Indians or Alaska Natives (10.1 percent), those reporting Two or More Races (10.2 percent), and those of Hispanic or Latino Origins (7.8 percent), significantly higher than the white unemployment rate of 4.0 percent (see Figure 3).

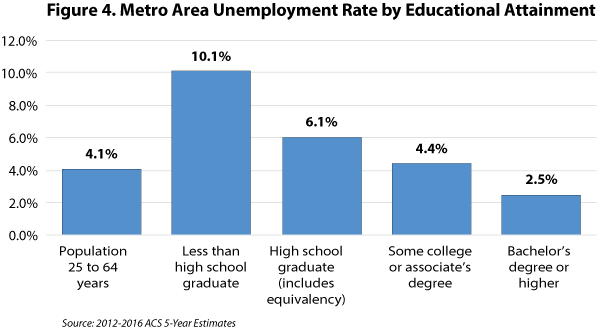
Figure 4 shows clearly that unemployment rates are also highly affected by educational attainment. As of the 2016 ACS 5-Year Estimates, the overall unemployment rate in the Metro Area for 25 to 64 year olds was 4.1 percent. Of those in that age cohort without a high school diploma or equivalent, the unemployment rate was much higher, at 10.1 percent. Overall, with further educational attainment the incidence of unemployment is significantly reduced (see Figure 4).

Beyond age, race and ethnicity, and educational attainment, unemployment rates can also be analyzed by a host of other indicators, including disability status, poverty status, and gender. Studying all of these indicators together can expose the challenges and opportunities that specific labor markets face. For example, what are the underlying causes for higher unemployment rates among Black and African Americans, American Indians and Alaska Natives, and those of Hispanic or Latino origins? What policies and actions can be taken to reduce these disparities? Similarly, how might teenagers and young adults find stronger connections with employers looking to hire? Or, with two-thirds of Metro Area job vacancies requiring a high school diploma or less, what strategies can be taken to reduce the high unemployment rates for those without postsecondary education?
For the Twin Cities Metro Area, currently experiencing the lowest unemployment in nearly two decades, understanding detailed labor force statistics will remain of paramount importance, especially with high labor force participation rates and an aging population.
1The Seven County Twin Cities Metro Area consists of Anoka, Carver, Dakota, Hennepin, Ramsey, Scott, and Washington counties.
2"Uncharted Territory." Minnesota Economic Trends, Minnesota Department of Employment and Economic Development, June 2018. Accessed July 23, 2018.