by Tim O'Neill
June 2024
Whether by air, water, or land, it's impossible to miss the presence and importance of the Transportation and Warehousing industry in the Seven-County Metro Area. This industry includes numerous subsectors, including Truck Transportation, Warehousing and Storage, and Air Transportation, that immediately come to mind when thinking of Transportation and Warehousing. The industry includes several other vital subsectors, including Couriers and Messengers, Postal Service, and Pipeline Transportation. The following article will spotlight Transportation and Warehousing in the Metro Area, including employment in its various subsectors, wages, demographic shifts, and occupational demand. Buckle up, it's time to hit the road with all things Transportation and Warehousing.
According to the Department of Employment and Economic Development's (DEED) Quarterly Census of Employment and Wages (QCEW), the Metro Area had 2,173 Transportation and Warehousing establishments supplying 77,550 covered jobs in 2023. As such, this industry accounted for approximately 4.4% of the Metro Area's total employment (Table 1). It's not ranked as one of the largest-employing industries in the region. It comes in as the region's 12th of 20 major industry sectors. Transportation and Warehousing clearly demands a closer look.
As previously stated, Transportation and Warehousing encompasses a wide variety of subsectors. Two subsectors sit nearly together at the top for total employment: Truck Transportation and Warehousing and Storage. Truck Transportation, with 13,644 covered jobs at 988 establishments, accounts for 17.6% of Transportation and Warehousing's total employment. This subsector is further subdivided into General Freight Trucking and Specialized Freight Trucking. About four-fifths (79.2%) of the Metro Area's Truck Transportation is General Freight Trucking. This type of trucking handles a wide variety of general commodities, generally palletized, and transported in a container or van trailer. Specialized Freight Trucking, making up the remaining 20.8% of the Metro Area's Truck Transportation employment, includes the transportation of cargo that requires specialized equipment for transportation. This might include furniture moving, used household and office goods moving, bulk liquids trucking, automobile carrier trucking, flatbed trucking, gravel hauling, and waste hauling.1
Closely following Truck Transportation, Warehousing and Storage accounts for a further 17.5% of the Metro Area's Transportation and Warehousing employment. This sector had 171 establishments supplying 13,543 covered jobs in the region in 2023. This sector is comprised of General Warehousing and Storage, Refrigerated Warehousing and Storage, Farm Product Warehousing and Storage, and Other Warehousing and Storage. The vast majority (96.5%) of the Metro Area's Warehousing and Storage employment is classified as General Warehousing and Storage. According to the North American Industry Classification System (NAICS) definition, establishments in this sector generally handle goods in containers, such as boxes, barrels, and drums, using equipment such as forklifts, pallets, and racks.
| Table 1. Transportation and Warehousing Industry Statistics in the Metro Area, Annual 2023 | |||||
|---|---|---|---|---|---|
| Industry | Number of Jobs | Share of Jobs | Number of Establishments | Total Payroll ($1,000s) | Avg. Annual Wage |
| Total, All Industries | 1,754,325 | 100.0% | 93,760 | $137,438,190 | $78,364 |
| Transportation and Warehousing | 77,550 | 4.4% | 2,173 | $5,587,550 | $72,072 |
| Truck Transportation | 13,644 | 17.6% | 988 | $971,374 | $71,188 |
| Warehousing and Storage | 13,543 | 17.5% | 171 | $741,739 | $54,704 |
| Air Transportation | 13,032 | 16.8% | 48 | $1,511,436 | $116,324 |
| Transit and Ground Passenger Transport. | 11,204 | 14.4% | 249 | $536,341 | $47,892 |
| Couriers and Messengers | 10,520 | 13.6% | 185 | $521,700 | $49,608 |
| Support Activities for Transportation | 8,175 | 10.5% | 358 | $704,027 | $86,112 |
| Postal Service | 7,074 | 9.1% | 138 | $569,257 | $80,472 |
| Pipeline Transportation | 198 | 0.3% | 13 | $26,262 | $133,120 |
| Scenic and Sightseeing Transportation | 101 | 0.1% | 12 | $2,407 | $29,224 |
| Water Transportation | 59 | 0.1% | 11 | $3,007 | $54,860 |
| Source: DEED Quarterly Census of Employment and Wages | |||||
Air Transportation makes its landing as the Metro Area's third largest-employing Transportation and Warehousing subsector. While having fewer establishments, 48 in 2023, this sector had just over 13,000 covered jobs in the region. Notably, Air Transportation is highly concentrated in the Metro Area. The region accounts for 94.5% of Minnesota's total Air Transportation employment. Warehousing and Storage is also highly concentrated in the Metro Area, with 91.5% of its respective statewide employment located right in the Metro Area. Overall, about two-thirds (67.7%) of Minnesota's Transportation and Warehousing employment in located in the Metro Area. With Air Transportation and Warehousing and Storage, Couriers and Messengers (89.9%) and Support Activities for Transportation (79.1%) have high concentrations of their respective statewide employment in the Metro Area. Those with smaller concentrations of Metro Area employment include Water Transportation (19.9%), Pipeline Transportation (31.2%), and Postal Service (42.1%).
Other Transportation and Warehousing subsectors with a significant number of jobs in the Metro Area include Transit and Ground Passenger Transportation (11,204 jobs), Couriers and Messengers (10,520 jobs), Support Activities for Transportation (8,175 jobs), and Postal Service (7,074 jobs). For some understanding of these subsectors, Transit and Ground Passenger Transportation includes urban transit systems and commuter rails, chartered buses and school buses, and taxis and limousine services. Support Activities for Transportation include a wide variety of establishments, with examples including air traffic control services, aircraft maintenance and janitorial services, motor vehicle towing, and street cleaning and snow clearing services. While more self-explanatory, Couriers and Messengers establishments provide intercity, local, and international delivery of parcels and documents while Postal Service establishments are engaged in providing mail services under the U.S. Postal Service and its subcontractors.
Average annual wages range from $29,223 in Scenic and Sightseeing Transportation to $133,120 in Pipeline Transportation. The average annual wage for all employment in the region's Transportation and Warehousing industry, at $72,072, was just below the average annual wage for the total of all industries, at $78,364.
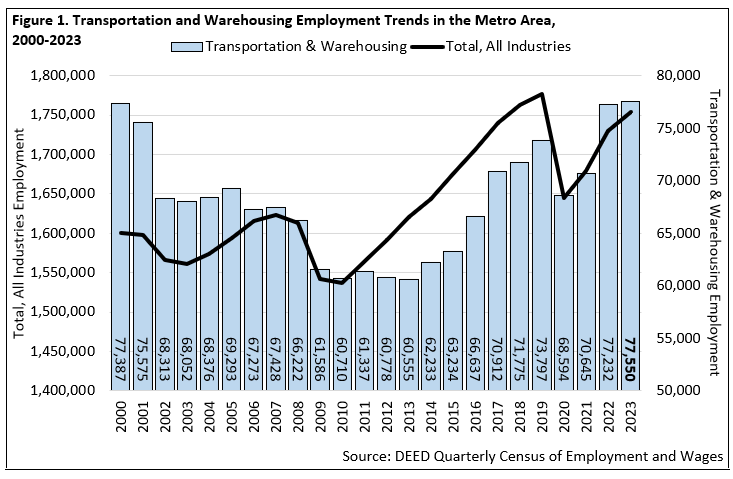
Like other industries in the Metro Area, Transportation and Warehousing was hit hard during the COVID-19 recession in 2020. Between annual 2019 and 2020, this industry lost just over 5,200 jobs. This decline of 7.1% was slightly less severe than the 7.4% decline in employment for the total of all industries. Since 2020, Transportation and Warehousing employment has rebounded, gaining nearly 9,000 jobs through 2023. This growth rate of 13.5% was more than twice the growth rate for the total of all industries during that period, at 6.7% (Figure 1).

As of annual 2023, Transportation and Warehousing employment in the Metro Area was up 5.1% from annual pre-COVID levels in 2019. This was equivalent to nearly 3,800 jobs. Only eight major industry sectors have exceeded their respective pre-COVID levels of employment, with Transportation and Warehousing coming in third for the strongest growth between 2019 and 2023. Only Health Care and Social Assistance and Construction have witnessed more employment growth during this period. Zooming in, employment growth in Transportation and Warehousing between 2019 and 2023 was led by Warehousing and Storage (4,728 jobs), Truck Transportation (889 jobs), and Support Activities for Transportation (+784 jobs). Employment losses during this period were experienced in Couriers and Messengers (684 jobs), Postal Service (451 jobs), Air Transportation (451 jobs), and Scenic and Sightseeing Transportation (14 jobs) (Table 2).
| Table 2. Transportation and Warehousing Industry Trends in the Metro Area, Annual 2019 – 2023 | |||||
|---|---|---|---|---|---|
| Industry | Number of Jobs | 2022 – 2023 Job Change | 2019 – 2023 Job Change | ||
| Numeric | Percent | Numeric | Percent | ||
| Total, All Industries | 1,754,325 | +24,269 | +1.4% | -22,114 | -1.2% |
| Transportation and Warehousing | 77,550 | +318 | +0.4% | +3,753 | +5.1% |
| Truck Transportation | 13,644 | +14 | +0.1% | +889 | +7.0% |
| Warehousing and Storage | 13,543 | -653 | -4.6% | +4,728 | +53.6% |
| Air Transportation | 13,032 | +998 | +8.3% | -451 | -3.3% |
| Transit and Ground Passenger Tran. | 11,204 | +815 | +7.8% | -1,021 | -8.4% |
| Couriers and Messengers | 10,520 | -1,206 | -10.3% | -684 | -6.1% |
| Support Activities and Transport. | 8,175 | +289 | +3.7% | +784 | +10.6% |
| Postal Service | 7,074 | +29 | +0.4% | -451 | -6.0% |
| Pipeline Transportation | 198 | +48 | +32.0% | +5 | +2.6% |
| Scenic and Sightseeing Transportation | 101 | -23 | -18.5% | -14 | -12.2% |
| Water Transportation | 59 | +7 | +13.5% | N/A | N/A |
| Source: DEED Quarterly Census of Employment and Wages | |||||
As the Transportation and Warehousing industry in the Metro Area continues to recover and expand following the COVID-19 recession, the industry continues to witness shifting demographics. Data from the U.S. Census Bureau's Quarterly Workforce Indicators (QWI) tool allows us to analyze how Transportation and Warehousing's employment has shifted by age, race and ethnicity, and gender.

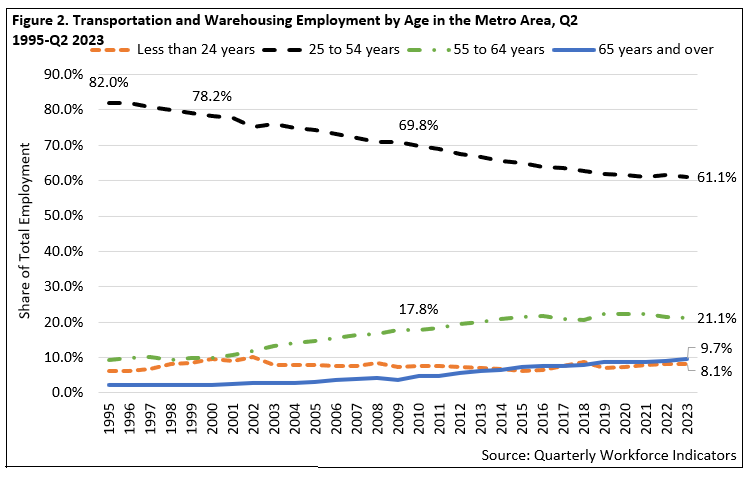
By age, one of the most notable shifts in Transportation and Warehousing employment has been the steady decline in those workers between the ages of 25 and 54 years. Workers in this cohort are typically defined as "prime working age," as they have the highest labor force participation rates of any other age cohort. In 1995 over four-of-five (82.0%) Transportation and Warehousing jobs in the Metro Area were held by workers between 25 and 54 years. Through 2023 this declined to about three-in-five (61.1%) (Figure 2). Put another way, the number of jobs held by prime-working age workers in Transportation and Warehousing fell by 22.0% between 1995 and 2023. This was equivalent to approximately 8,400 jobs. This industry, as a whole, expanded by 4.8% during this time or about 2,200 jobs.
While the prime-working age cohort has shifted down over the past three decades, the share of older workers has greatly expanded. Between 1995 and 2023 the number of Transportation and Warehousing jobs held by workers 65 years of age and older spiked by 351.9% (3,670 jobs). The number of such jobs held by workers between 55 and 64 years spiked by 136.6% (5,947 jobs). As such, the share of Transportation and Warehousing jobs in the Metro Area held by workers 55 years of age and older increased from about one-in-10 (11.6%) in 1995 to about three-in-10 (30.8%) in 2023 (Figure 2). Of the 20 major industry sectors in the Metro Area, Transportation and Warehousing has the highest share of its respective jobs held by workers 55 years of age and older. This share is 23.1% for the total of all industries.
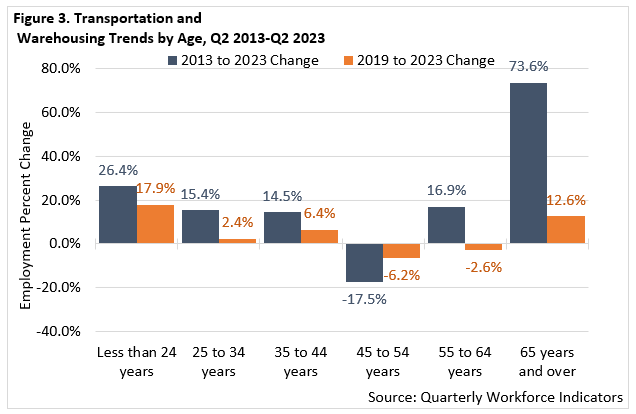
Interestingly, those workers in the youngest age cohort also witnessed an increase between 1995 and 2023. During that period, Metro Area Transportation and Warehousing jobs held by workers 24 years of age and younger increased by 33.2% (981 jobs). These age trends have largely held in more recent years, with the largest gains in employment for those workers at either end of the age spectrum (Figure 3).

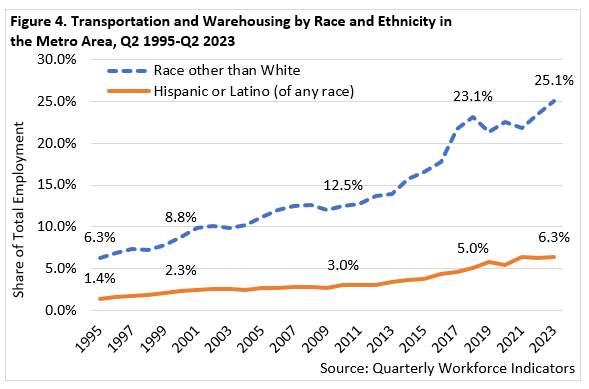
Meanwhile, when we analyze trends by race and ethnicity, workers in Transportation and Warehousing have become steadily more diverse. Over the past three decades, the share of Transportation and Warehousing jobs in the Metro Area held by workers reporting as a race other than white increased from 6.3% to 25.1% (Figure 4). In other words, between 1995 and 2023, the number of Transportation and Warehousing jobs held by workers reporting as a race other than white increased by 320.2% (9,317 jobs). The number of such jobs held by white workers decreased during this period by 16.3% (-7,105 jobs). Meanwhile, the number of such jobs held by workers reporting Hispanic or Latino origins increased by 385.7% (2,449 jobs).

By gender, Transportation and Warehousing employment leans male. In 2023 just over one-quarter (27.9%) of the Metro Area's Transportation and Warehousing workers were female. This share has remained largely unchanged over the past three decades. If we analyze more recent trends, however, this industry has shown a more rapid increase in the number of female workers. Between 2013 and 2023, the number of such jobs held by female workers increased by 19.7% (2,235 jobs). The number of such jobs held by male workers increased by 8.2% (2,654 jobs).
The highest concentration of Transportation and Warehousing occupations are in the Transportation and Material Moving Occupations occupational group. This occupational group accounts for nearly 130,000 jobs in the Metro Area and can be broken down into 50 specific occupations. These occupations range from Heavy and Tractor-Trailer Truck Drivers to School Bus Drivers to Stockers and Order Fillers. The Transportation and Warehousing industry has a variety of other occupations from other occupational groups as well. An example of some of these occupations include Customer Service Representatives; General Office Clerks; Shipping, Receiving, and Inventory Clerks; and Bus and Truck Mechanics and Diesel Engine Specialists.
Many of these occupations are in high demand in the Metro Area, with most requiring a high school diploma or equivalent (Table 3). Of course, being in transportation, many of these occupations will likely require a driver's license or other similar licenses and certifications.
| Table 3. Transportation and Warehousing and Related Occupations in Demand in the Metro Area Sorted by Current Occupational Demand in the Metro Area | |||||
|---|---|---|---|---|---|
| SOC Code | Occupation | Employment | 25th Percentile Wage | Median Wage | Educational Requirements |
| 434051 | Customer Service Representatives | 42,440 | $40,579 | $49,374 | High school diploma or equivalent |
| 411011 | First-Line Supervisors of Retail Sales Workers | 9,950 | $43,520 | $49,788 | High school diploma or equivalent |
| 537062 | Laborers and Freight, Stock, and Material Movers, Hand | 33,730 | $40,476 | $47,597 | High school diploma or equivalent |
| 537065 | Stockers and Order Fillers | 23,360 | $36,440 | $39,688 | High school diploma or equivalent |
| 533032 | Heavy and Tractor-Trailer Truck Drivers | 18,870 | $54,593 | $64,047 | High school diploma or equivalent |
| 439061 | Office Clerks, General | 32,970 | $40,509 | $48,707 | High school diploma or equivalent |
| 533033 | Light Truck Drivers | 10,000 | $44,573 | $49,498 | High school diploma or equivalent |
| 111021 | General and Operations Managers | 44,460 | $69,958 | $106,095 | Bachelor's degree |
| 531047 | First-Line Supervisors of Transportation and Material-Moving Workers | 5,780 | $60,295 | $74,288 | High school diploma or equivalent |
| 435071 | Shipping, Receiving, and Inventory Clerks | 8,270 | $40,503 | $48,139 | High school diploma or equivalent |
| 533051 | Bus Drivers, School | 4,540 | $49,714 | $50,702 | High school diploma or equivalent |
| 533031 | Driver/Sales Workers | 5,780 | $23,631 | $29,550 | High school diploma or equivalent |
| Source: DEED Occupational Employment and Wage Statistics, Occupations in Demand, Educational Requirements | |||||
1North American Industry Classification System, United States Census Bureau.