Dave Senf
December 2016
Note: All data except for Minnesota’s PMI have been seasonally adjusted. See the feature article in the Minnesota Employment Review, May 2010, for more information on the Minnesota Index.
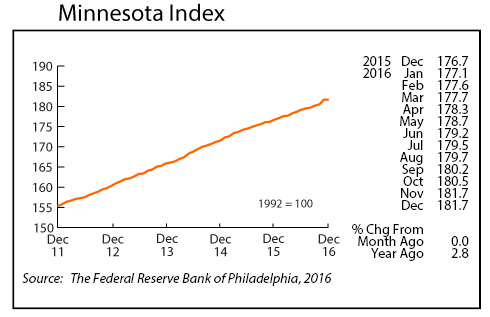
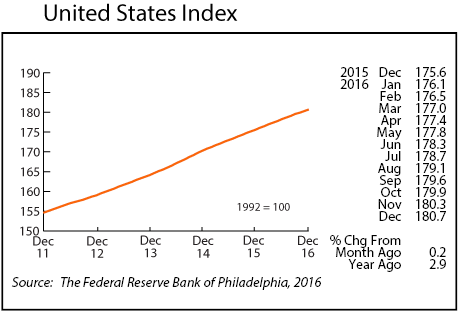
The Minnesota Index, after surging in November, moved sideways in December. An uptick in the unemployment rate and a sharp drop in average weekly manufacturing hours offset expanding wage and salary employment to keep December’s index unchanged from the previous month. The U.S. index increased 0.2 percent for the sixth month in a row.
Minnesota’s index was up 2.8 percent when measured from December 2015 to December 2016. By that measure, Minnesota’s economic growth was just below U.S. growth which increased 2.9 percent over the same period. Minnesota’s relative economic performance, however, was slightly weaker than the nation’s when annual averages for the indices are compared. Annual average growth for Minnesota’s index was 2.7 percent versus 3.0 percent for the U.S. Economic growth in Minnesota in 2016 was the weakest since 2010 no matter which method was used to calculated annual growth.
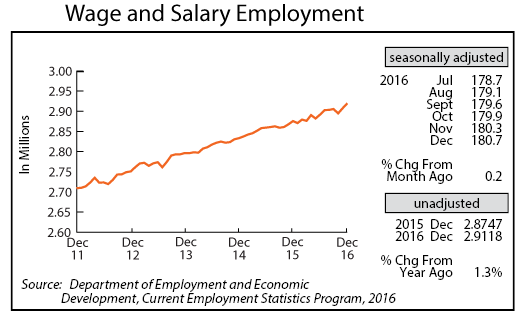
Minnesota’s adjusted Wage and Salary Employment finished the year with a flourish as 11,900 jobs were added in December. Private sector employment climbed 8,200 positions while public sector payrolls expanded by 3,700. The 21,700 private jobs added during the last two months was the second highest two-month total over the last 36 years. The 7,700 goods-producing jobs added over the last two months was the highest two-month total in the last 36 year as was the two-month payroll expansion in the Construction sector. Almost all of the jump in goods-producing jobs were Construction jobs. Educational and Health Services and Professional and Business Services also picked up hiring in December. Leisure and Hospitality was the only sector with significant job cutbacks.
Minnesota’s unadjusted wage and salary employment was up 1.3 percent from a year ago in December which was only a tad behind the national 1.4 percent gain. Minnesota job growth, on an annual average basis in 2016, however, was also 1.3 percent while the U.S. rate was 1.7 percent. National job growth was much stronger for most of 2016 than in Minnesota. Minnesota’s job growth last year was the slowest since 2010. Job growth in the state averaged 1.6 between 2011 and 2016 and 2.0 percent between 1950 and 2016.
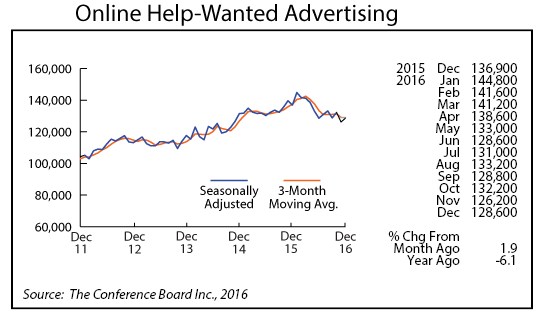
Online Help-Wanted Ads zagged up in December to 128,600. Online job advertising was up 1.9 percent in Minnesota and 1.6 percent nationally. Online help-wanted ads, after peaking early in 2016, slipped during the first six months of the year and have been essentially flat over the second half of the year. Average monthly online job listings were up 0.3 percent in Minnesota in 2016 compared to 2015 but down 7.6 percent nationally.
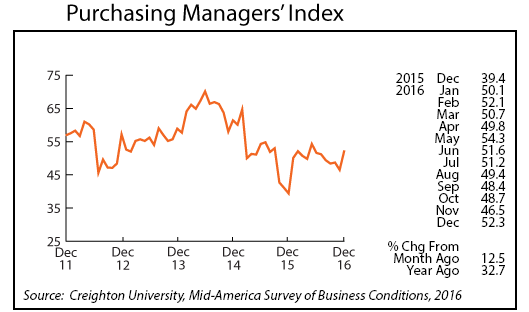
Minnesota’s Purchasing Managers’ Index (PMI), which had been slipping since May, climbed to 52.3 in December, its highest level since May. Manufacturing nationally has been gradually rebounding since the middle of 2016 but has been weaker in Minnesota. The Mid-American Business Conditions Index, including Minnesota, climbed to 53.1 while the corresponding national index jumped to 54.7. All three indices point to improving manufacturing activity over the next few months.
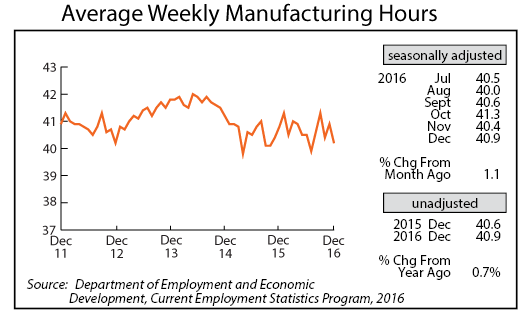
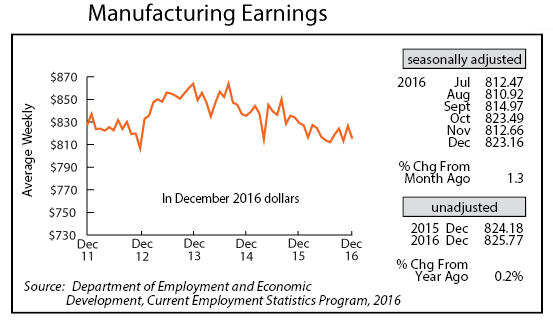
Any rebound in Minnesota’s manufacturing sector didn’t show up in adjusted Manufacturing Hours in December as the factory hours fell to 40.2, the lowest level since July. Average weekly Manufacturing Earnings also dropped in December, slipping to $815.37. Manufacturing employment in Minnesota was basically flat in 2016 with annual average employment down just 300 jobs or 0.1 percent from 2015. Manufacturing employment nationally dropped 0.3 percent last year.
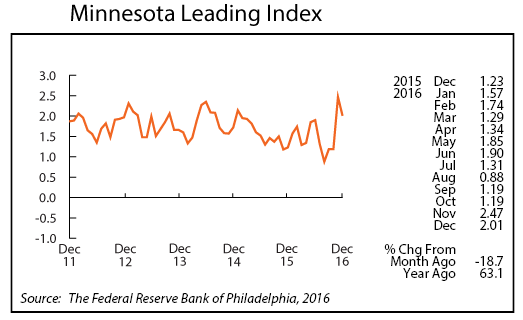
The Minnesota Leading Index tailed off a bit in December but remained elevated compared to the readings over the last two years. December’s 2.01 reading points to Minnesota’s economy accelerating during the first half of 2017. Minnesota’s Leading Index was significantly higher than the national index for the second straight month which indicates that Minnesota’s economy will outpace U.S. growth over the next six months.
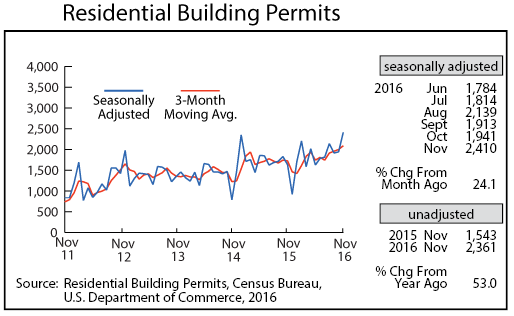
Adjusted Residential Building Permits inched down in December to 2,380. That is the highest December total since 2004. Building permits rose sharply in the second half of 2016, pushing permits for the year 16.4 percent higher than the 2015 total. Total permits last year were only 6 percent below the 46-year average.
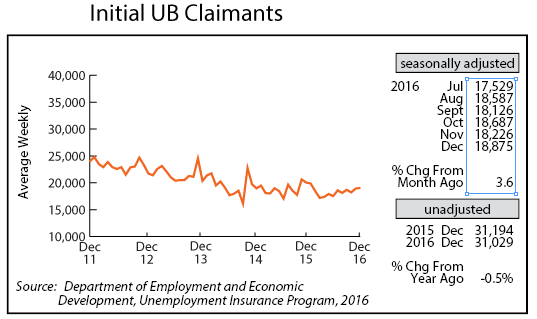
Adjusted Initial Claims for Unemployment Benefits (UB) climbed for the third time in the last four months in December. December’s 19,055 initial claims was the highest total since last December. Total initial claims for 2016 were 2.5 percent lower than the previous year despite an upward drift in initial claims over the last nine months.
