by Luke Greiner
December 2018
Minnesota has a smaller concentration of occupations most at risk compared to the U.S. – and that's good news. But workers still need to keep up.
With near-record low unemployment rates and a labor force growing much slower than in the past, could automation be the boost Minnesota needs to maintain its global economic position?
At odds with that view and our current labor force situation, is the notion that new technologies will destroy so many jobs that our labor market will be systematically dismantled by robots. Many discussions about the future of work result in conclusions that are not only far-fetched, but unhelpful.
This article leverages the Information Technology & Innovation Foundation1 (ITIF) analysis of occupations and its index of how 'at risk' each occupation is of being impacted by automation. With an increasing amount of research on this topic, analyses range from hardly concerning to widespread unemployment.2 The ITIF analysis is a plausible, middle-of-the-road assessment of how technology will impact different occupations.
The ITIF analysis relies on Bureau of Labor Statistics employment projections in conjunction with its own analysis of 840 occupations, and assigns a risk level to each on a scale of 1 to 5.3 Merging the ITIF occupational risk indicator with other data produced by DEED, including employment, wages, educational requirements, and employment projections, provides a reasonable perspective on how technology will impact Minnesota's labor market.
Fears of technology's impact on work and jobs can be traced back at least to the 16th century when Queen Elizabeth I denied William Lee a patent on his knitting machine: "Thou aimest high, Master Lee. Consider thou what the invention could do to my poor subjects. It would assuredly bring to them ruin by depriving them of employment, thus making them beggars." 4
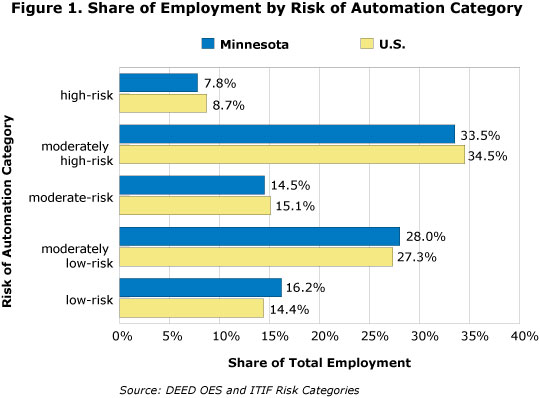
The ITIF's risk index covers virtually every occupation recognized by official employment data. Using this index, Minnesota has a smaller relative concentration of occupations most at risk to be impacted by automation compared to the nation. Using the most recent employment data, 7.8 percent of jobs in Minnesota have a high risk of being automated, more than a full percentage point less than the U.S. share. The moderately high-risk category contains the largest share of jobs in Minnesota (33.5 percent of employment), followed by moderately low-risk (28 percent of employment). Worth noting is that there are more than twice as many jobs in occupations with the lowest risk of automation compared to the highest-risk category. Only 44 occupations fall into the high-risk category, according to ITIF, but combined they total 213,290 jobs. (Figure 1).

Even for occupations identified as high-risk or moderately high-risk, it is unlikely that employment in entire occupations will be eliminated; instead, many of these occupations will be augmented by technology to increase productivity.
Table 1 looks at occupations with at least 1,000 jobs in the highest-risk category. Twenty-six occupations meet these criteria, with a combined employment of more than 207,000 jobs across Minnesota. These occupations account for 97 percent of employment categorized as high risk. The two largest occupations, cashiers and customer service representatives, account for 60 percent of the jobs identified as high risk to be automated. It's highly unlikely that every cashier or customer service representative job can, or will, be automated. There is already a high level of automation in these occupations, as a visit to your local big box store or a call to your cell phone service provider will confirm.
As illustrated in Figure 1, Minnesota has fewer jobs at high risk of being automated. The location quotient (LQ) column (Table 1) describes Minnesota's concentration of employment relative to the U.S. An LQ value over one means employment in that occupation is more concentrated in Minnesota, while an LQ value of less than one indicates less concentration in Minnesota. The most overrepresented occupations at high risk for automation in Minnesota are brokerage clerks; credit analysts; and reservation, ticket, and travel agents. Other occupations with an LQ greater than one are in boldface.
| Table 1. Minnesota Occupations With Highest Risk of Automation and Employment over 1,000 | |||||
|---|---|---|---|---|---|
| SOC Code | Occupational Title | Location
Quotient |
Employment | Median Wage | Minimum Education Typically Required |
| 0 | Total, All Occupations | 1.0 | 2,838,270 | $20.07 | |
| 412011 | Cashiers | 0.9 | 66,230 | $10.78 | High School or Less |
| 434051 | Customer Service Representatives | 1.0 | 57,240 | $18.11 | High School or Less |
| 537051 | Industrial Truck and Tractor Operators | 0.8 | 8,630 | $19.25 | High School or Less |
| 433071 | Tellers | 0.8 | 8,280 | $13.45 | High School or Less |
| 359021 | Dishwashers | 0.7 | 6,940 | $10.91 | High School or Less |
| 433021 | Billing and Posting Clerks and Machine Operators | 0.7 | 6,660 | $19.59 | High School or Less |
| 434181 | Reservation, Transportation Ticket Agents, Travel Clerks | 1.9 | 5,470 | $25.75 | High School or Less |
| 513022 | Meat, Poultry, and Fish Cutters and Trimmers | 1.3 | 4,100 | $14.25 | High School or Less |
| 292071 | Medical Records and Health Information Technicians | 1.0 | 4,010 | $22.69 | Vocational Training |
| 533041 | Taxi Drivers and Chauffeurs | 0.8 | 3,210 | $13.27 | High School or Less |
| 434031 | Court, Municipal, and License Clerks | 1.2 | 3,140 | $21.47 | High School or Less |
| 132041 | Credit Analysts | 2.1 | 3,060 | $36.35 | Bachelor's Degree |
| 439021 | Data Entry Keyers | 0.8 | 3,020 | $16.41 | High School or Less |
| 433051 | Payroll and Timekeeping Clerks | 1.0 | 2,920 | $23.05 | High School or Less |
| 434011 | Brokerage Clerks | 2.4 | 2,820 | $23.12 | High School or Less |
| 393031 | Ushers, Lobby Attendants, and Ticket Takers | 1.1 | 2,820 | $11.05 | High School or Less |
| 519121 | Coating, Painting, and Spraying Machine Operators | 1.5 | 2,660 | $19.26 | High School or Less |
| 536031 | Service Station Attendants | 1.1 | 2,520 | $12.53 | High School or Less |
| 493021 | Automotive Body and Related Repairers | 0.8 | 2,310 | $21.52 | High School or Less |
| 434199 | Information and Record Clerks, All Other | 0.7 | 2,260 | $21.07 | High School or Less |
| 536021 | Parking Lot Attendants | 0.8 | 2,200 | $11.52 | High School or Less |
| 434071 | File Clerks | 0.7 | 1,540 | $15.78 | High School or Less |
| 273091 | Interpreters and Translators | 1.4 | 1,470 | $25.30 | High School or Less |
| 232093 | Title Examiners, Abstractors, and Searchers | 1.3 | 1,410 | $26.95 | High School or Less |
| 319094 | Medical Transcriptionists | 0.9 | 1,050 | $21.25 | Vocational Training |
| 435021 | Couriers and Messengers | 0.7 | 1,050 | $13.22 | High School or Less |
| Source: DEED OES, Educational Requirements and ITIF Risk Categories | |||||
Estimated risk of automation for all occupations in Minnesota based on the ITIF analysis.
Just over 11,400 jobs in four occupations have a median hourly wage of $25 per hour or more. In contrast, there are nine occupations with median wages less than $15 per hour with combined employment over 97,000 in the high-risk category. The vast majority of occupations with the highest risk of being impacted by automation typically require a high school diploma/GED or less for entry into the occupation.
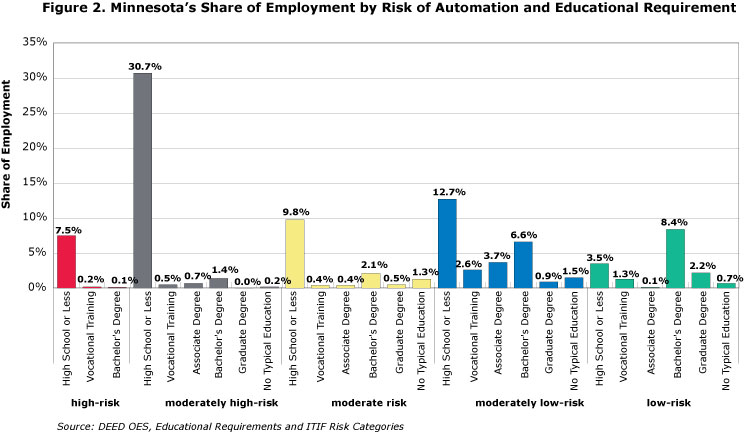
According to the ITIF's risk index, 96 percent of the jobs in occupations considered high-risk for automation have low educational requirements – a high school diploma or less. This group represents 7.5 percent of all jobs in Minnesota. Only 0.2 percent of jobs deemed high risk require a vocational degree, and 0.1 percent of jobs require a bachelor's degree. No occupations requiring a graduate degree were categorized as high risk.
However, higher education requirements do not necessarily mean low risk of automation, with the correlation between education and risk somewhat weak. In the lowest risk category there is actually more employment in occupations that can be attained with a high school diploma or less than those requiring a graduate degree. In the moderately low-risk category, occupations that require a high school diploma or less account for 12.7 percent of all jobs in the state, almost double the number of jobs in the same risk category that require a bachelor's degree, (Figure 2).

To be sure, more than twice as many occupations in the low-risk category require a graduate degree compared to a high school diploma or less, but employment in occupations requiring just a high school diploma is 60 percent greater than those requiring a graduate degree.
Even occupations in the low-risk category are likely to see technological advances that increase productivity. For instance, there are a large number of teaching occupations in the low-risk category. While the teaching occupation is unlikely to disappear, technology is increasing the capacity and decreasing costs as seen with massive open online courses, or MOOCs (Figure 2).
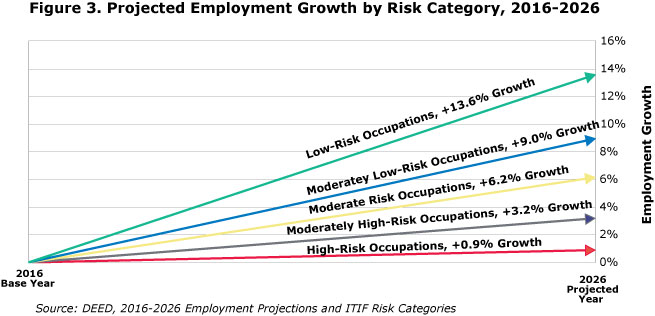
DEED's most recent employment projections (2016-2026) project an overall employment growth rate of 5.8 percent in Minnesota. Employment growth for each risk category is highly correlated to long-term occupational growth rates in Minnesota, with the fastest growth (13.6 percent) occurring for occupations in the low-risk category; high-risk occupations have the slowest growth of less than 1 percent. This is not merely a coincidence. DEED's employment projections utilize the BLS projection methodology that includes technological innovation, changes in business practices or production methods, replacement of one product or service by another, organizational restructuring of work, offshoring and domestic outsourcing, and many others (Figure 3).

Although employment growth in Minnesota is projected to be almost 6 percent, between 2015 and 2025, labor force growth is projected to be an anemic 1.9 percent. To put that in perspective, the labor force grew by 5.4 percent in the 10-year period ending in 2017. Considering labor force constraints, Minnesota is more likely to benefit from automation now than ever before. Aligning workforce and educational programs with current occupational demand and projected employment growth is one strategy to help keep Minnesota growing.
Regardless of future technological changes, if the ITIF index is any indicator, the importance of lifelong learning is, and will continue to be, essential to remaining relevant and valuable in the workforce.
1Accessed on 11/1/18: About ITIF: A Champion for Innovation
2Oxford study predicting 47% of jobs can be destroyed in the next 20 years, The Future of Employment
3Unfortunately, Technology Will Not Eliminate Many Jobs, accessed 11/1/18, Unfortunately Technology will not Eliminate Many Jobs
4Why Nations Fail, Chapter 7, pg. 182.