By Amanda Rohrer
December 2014
Most manufacturing sectors in the state have seen some employment growth since 2009, but some are doing better than others as the industry evolves.
Manufacturing comprises a diverse set of industries that are constantly in flux. Where assembly line workers in factories once were the norm, innovations like 3D printing and sophisticated machinery are changing manufacturing. Furthermore, wages and working conditions vary widely within the sector. Food manufacturing generally is a low-wage and low-skill sector, while medical device manufacturing requires higher skills and offers better pay.
Manufacturing has made up a declining share of employment in Minnesota and nationally over the last several decades. The industry saw little of the massive employment gains in the 1990s and experienced steeper declines than overall employment in both the 2001 and 2007 recessions. Although manufacturing has been adding jobs in the current recovery, the industry is unlikely to regain its prerecession peak much less its overall peak (see Figure 1).
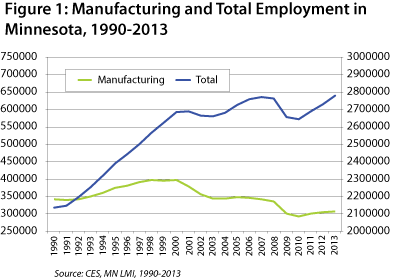
These trends haven't hit all manufacturing industries evenly, though. Some industries have seen employment grow, some have stayed steady and others have plummeted much faster than the sector as a whole. Further investigation can help us understand more about the switch to the "service economy" and how not just the number but the types of available manufacturing jobs are changing.
In Minnesota, the manufacturing industries that are faring well are shifting the sector away from our traditional mix. This analysis calculated employment change since 2000 and since the recession ended in 2009 for each detailed (six-digit NAICS) manufacturing industry. The results are displayed on a scatter plot (see Figure 2) and divided into four groups. "Emerging Industries" grew both since the recession started and since 2000. "Declining Industries" declined in both time periods. "Rebound Industries" grew since the recession but are still at lower levels than in 2000. "Lagging Industries" grew since 2000 but are still below their recession levels.
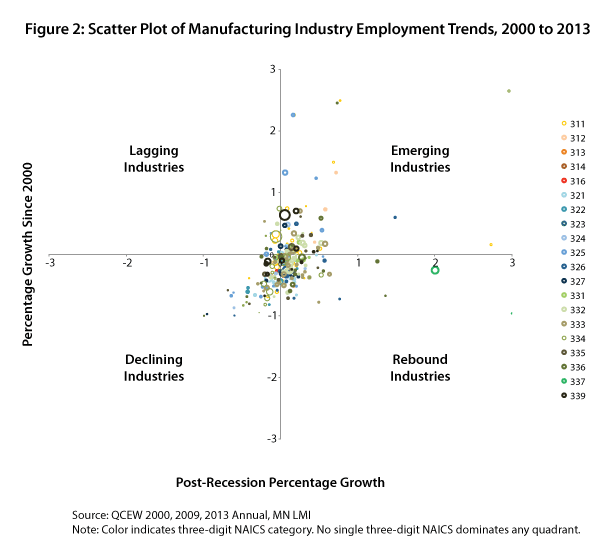
The overall growth trend is apparent. Although clustered around no change, most manufacturing industries have seen some employment growth since 2009, with some significant outliers in the positive territory (including some not displayed because they're off the axis). Most outliers are small or mid-size industries.
Lagging Industries are the rarest. Most industries that are suffering now were already on a downward trajectory that picked up pace during the recessions. Generally, employment in Lagging Industries is more stable with fairly flat employment trends.
The industries in each group vary dramatically on a number of characteristics. By examining trends separately, we can get a sense of what kind of firms are growing or declining and a hint at why.
Declining and Rebound Industries make up a majority of employment overall and share a pre-recession downward trend (see Figure 3). Rebound Industries, however, have grown enough to reach 2007 employment levels. The declines since 2000 happened between 2000 and 2007, mostly during the recession in 2001. The pace of decline in Declining Industries has been steady, down 40,000 jobs since 2000.
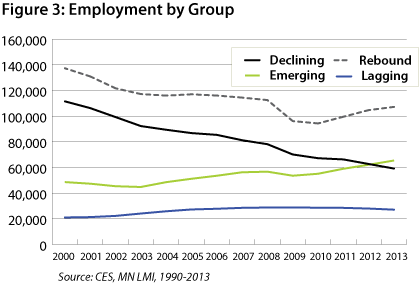
Emerging Industries have been on a similarly steady growth trajectory, with growth beginning after the 2001 recession and only stumbling in 2007. The pace and overall number of jobs has been much slower and smaller, however.
Lagging Industries are characterized by much less overall change. They have relatively few jobs in the state and tend to be concentrated in medical device firms in the Twin Cities.
The fastest pace of growth and most new/returning jobs since the recession come from Rebound Industries.
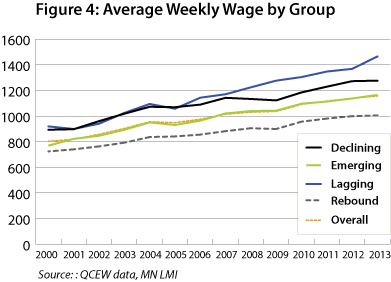
These trends are of particular concern when we look at wages (see Figure 4). Lagging and Declining Industries have the highest wages, so the best-paid jobs in manufacturing are making up a smaller and smaller share of the total.
Emerging Industries are right in the middle on wages, while wages for Rebound Industries lag the average by a steadily increasing gap - $80 per week in 2000 to $150 per week in 2013. Overall, this means that most of the manufacturing jobs that have returned since the recession pay well below the jobs they've replaced.
The size of a firm also can be relevant to the types of jobs it provides. Larger firms often allow more specialization in jobs, and economies of scale make them more likely to provide good benefits. Smaller firms can be more flexible and responsive to change. Average firm size has changed since 2000 as well (see Figure 5).
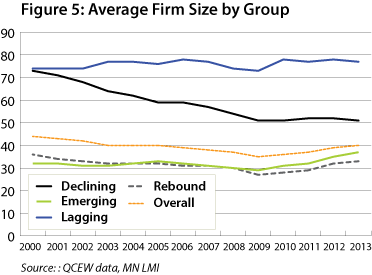
Lagging Industries are the largest on average and most consistent in size since 2000, likely the same firms with stable employment over this time. Declining Industries are large but shrinking, likely due to layoffs not closures. The Emerging and Rebound groups are made up of small but growing firms. Overall, new firms are small but growing, while larger, established firms are shrinking.
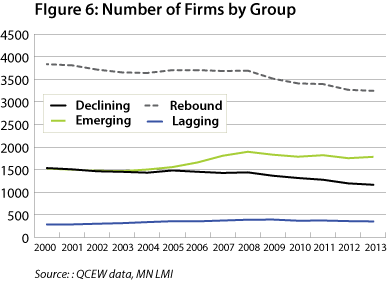
Overall, Rebound and Declining firms are closing (see Figure 6), although the Rebound firms that remain are growing in size. Employment growth in Rebound Industries is likely coming from expansion and consolidation. The number of Lagging firms is stable, while the number of Emerging firms was growing until the recession but has since dropped slightly. New firms might be the next area of growth in manufacturing as confidence in the economy improves.
The geographic dispersion of manufacturing employment varies by growth category as well (see Table 1). Lagging Industries (78.1 percent) are largely in the metros (including St Cloud, Duluth, Rochester, Mankato, Fargo and Grand Forks). Rebound Industries are disproportionately represented (21.1 percent) in micropolitan areas, which account for 17.7 percent of all manufacturing jobs in the state. Emerging Industries are disproportionately not in micropolitan areas (13.3 percent). Lagging Industries are under-represented in rural areas (6.7 percent, compared with 12.8 percent of manufacturing jobs overall).
Lagging Industries are stable and established, and they tend to be centered in the Minneapolis-St Paul-Bloomington MSA (11-county area). Emerging Industries - largely new and small firms - also are largely within the Twin Cities MSA. Job creation in manufacturing is happening in the core cities. Declining Industries tend to be more rural and further from the metros.
| Percent of Employment by Geography and Category (Using Pre-2013 Metro Definitions) | |||||
|---|---|---|---|---|---|
| Declining | Emerging | Lagging | Rebound | Overall | |
| Metro | 67.9% | 74.8% | 78.1% | 65.1% | 69.5% |
| Micro | 17.4% | 13.3% | 15.2% | 21.1% | 17.7% |
| Rural | 14.7% | 11.9% | 6.7% | 13.8% | 12.8% |
| MSP | 48.5% | 65.0% | 68.4% | 50.7% | 55.6% |
| Non-MSP | 51.5% | 35.0% | 31.6% | 49.3% | 44.4% |
| Source: QCEW 2000, 2009, 2013 Annual, MN LMI | |||||
Over the long term, manufacturing employment in Minnesota is declining. The decline is driven by certain industries. Others are growing, but it's difficult to get a clear view of patterns from the detailed industries because there are many of them and they are small. An industry with 20 employees can double with little overall impact, but significant patterns can be missed if individual small industries are ignored. To counter these challenges, a large number of industries was sorted by percentage change.
Declining Industries comprise a broad mix of manufacturers, including construction products, high tech consumer products and aircraft (highlighted in Table 2).
| Top 15 Declining Industries (Excluding Industries Smaller Than 20 in 2013) | ||
|---|---|---|
| Industry | 2013 Employment | Percent Change 2009-2013 |
| Mineral Wool Manufacturing | 21 | -95.2 |
| Paint and Coating Manufacturing | 263 | -63.6 |
| Asphalt Paving Mixture and Block | 88 | -60.2 |
| Electronic Coils, Transformer and Inductor | 258 | -47.9 |
| Railroad Rolling Stock Manufacturing | 88 | -44.0 |
| Audio and Visual Equipment Manufacturing | 208 | -43.8 |
| Folding Paperboard Box Manufacturing | 641 | -43.1 |
| Newsprint Mills | 279 | -41.9 |
| Roasted Nuts and Peanut Butter Manufacturing | 158 | -41.3 |
| Noncurrent-Carrying Wiring Devices | 46 | -40.3 |
| Reconstituted Wood Product Manufacturing | 434 | -33.2 |
| Industrial Process Furnaces and Ovens | 200 | -29.8 |
| Aircraft Engine and Engine Parts | 83 | -25.2 |
| Photographic Film and Chemicals | 283 | -25.1 |
| Aircraft Manufacturing | 422 | -25.0 |
| Source: QCEW 2000, 2009, 2013 Annual, MN LMI | ||
Emerging Industries tend to produce supply-chain industrial products, including metal processing and motor vehicle parts, rather than products for retail sale. The exception seems to be in food products. A disproportionate number of food and beverage production industries are represented in this group (highlighted in Table 3). Many of these - coffee, tea, beer, wine, liquor - are likely specialty luxury goods that serve a niche market without much potential for huge growth.
| Top 20 Emerging Industries | ||
|---|---|---|
| Industry | 2013 Employment | Percent Change 2009-2013 |
| Secondary Processing, Other Nonferrous | 263 | 592.1 |
| Electronic Connector Manufacturing | 511 | 296.1 |
| Frozen Pastry Manufacturing | 433 | 273.3 |
| Tire Retreading | 174 | 148.6 |
| Dried and Dehydrated Food Manufacturing | 429 | 142.4 |
| Wineries | 199 | 134.1 |
| Misc. Nonmetallic Mineral Products Manufacturing | 504 | 115.4 |
| Mattress Manufacturing | 585 | 110.4 |
| Coffee and Tea Manufacturing | 266 | 77.3 |
| Motor Vehicle Steering/Suspension Parts | 90 | 73.1 |
| Distilleries | 284 | 72.1 |
| Tortilla Manufacturing | 409 | 68.3 |
| Breweries | 571 | 58.2 |
| Industrial Mold Manufacturing | 1,968 | 57.3 |
| Adhesive Manufacturing | 723 | 54.2 |
| Small Arms Ammunition Manufacturing | 1,715 | 53.0 |
| Truck Trailer Manufacturing | 894 | 52.6 |
| Fluid Milk Manufacturing | 1,139 | 51.7 |
| Fasteners, Buttons, Needles, and Pins | 67 | 48.9 |
| Optical Instrument and Lens Manufacturing | 579 | 48.5 |
| Source: QCEW 2000, 2009, 2013 Annual, MN LMI | ||
Lagging Industries include more complex and high-tech manufacturing, including medical device firms (highlighted in Table 4). All industries in this small group are listed in the table.
| Lagging Industries | ||
|---|---|---|
| Industry | 2013 Employment | Percent change 2009-2013 |
| Irradiation Apparatus Manufacturing | 25 | 0.0 |
| Cut Stone and Stone Product Manufacturing | 1,407 | -0.3 |
| Printed Circuit Assemblies | 2,126 | -1.0 |
| Paperboard Mills | 181 | -2.2 |
| Industrial Valve Manufacturing | 647 | -4.0 |
| Electromedical Apparatus Manufacturing | 12,898 | -5.5 |
| Animal (Except Poultry) Slaughtering | 5,121 | -6.3 |
| Commercial Bakeries | 2,898 | -7.4 |
| Agricultural Chemicals Except Fertilizer | 43 | -12.2 |
| Plastics Packaging Film and Sheet | 165 | -13.2 |
| Other Aircraft Parts and Equipment | 233 | -18.3 |
| Pharmaceutical Preparation Manufacturing | 1,163 | -18.6 |
| Magnetic and Optical Media Manufacturing | 160 | -19.2 |
| Power-Driven Handtool Manufacturing | 63 | -21.3 |
| Source: QCEW 2000, 2009, 2013 Annual, MN LMI | ||
Rebound Industries have a lot of heavy machinery and disproportionately include industries that manufacture vehicles and vehicle parts (highlighted in Table 5).
| Top 15 Rebound Industries | ||
|---|---|---|
| Industry | 2013 Employment | Percent change 2009-2013 |
| Travel Trailer and Camper Manufacturing | 509 | 125.2 |
| Metal Household Furniture Manufacturing | 392 | 87.6 |
| Fluid Power Pump and Motor Manufacturing | 868 | 63.5 |
| Mechanical Rubber Product Manufacturing | 528 | 57.1 |
| Motor Vehicle Metal Stamping | 197 | 55.1 |
| Custom Architectural Woodwork and Millwork | 501 | 52.7 |
| Semiconductor and Related Devices | 1,764 | 52.2 |
| Welding and Soldering Equipment Manufacturing | 118 | 49.4 |
| Hardwood Veneer and Plywood Manufacturing | 88 | 46.7 |
| Analytical Laboratory Instruments | 241 | 37.7 |
| Machine Tool Cutters and Accessories | 547 | 37.4 |
| Secondary Smelting/Alloying of Aluminum | 133 | 37.1 |
| Bolts, Nuts, Screws, Rivets, and Washers | 309 | 32.6 |
| Petroleum Lubricating Oil and Grease | 132 | 32.0 |
| Mechanical Power Transmission Equipment | 238 | 31.5 |
| Source: QCEW 2000, 2009, 2013 Annual, MN LMI | ||
Location quotients (LQs), which measure employment concentration, were calculated as the share of all manufacturing in Minnesota relative to the rest of the country. Industries with a 2009-2013 change in LQ of 0.3 or higher were selected. Not all industries matched up. Some had unpublished U.S. values or missing years that made LQ calculations impossible, so this analysis is not exhaustive.
What stands out about LQs is how little they have changed even in industries that have grown or declined a lot since 2009. When the LQ doesn't change much, it means that the industry is growing or declining locally at about the same pace as nationally.
In Declining Industries, the significant declines were in computer storage device and cheese manufacturing, but both were still more concentrated here than nationally (see Table 6). Leather hide tanning and finishing increased LQ despite declines overall, but that's a very small industry.
| Declining Industries | 2009 LQ | 2013 LQ | 2009-2013 Change in LQ |
|---|---|---|---|
| Computer Storage Device Manufacturing | 6.3 | 4.9 | -1.4 |
| Asphalt Paving Mixture and Block | 0.6 | 0.3 | -0.3 |
| Leather and Hide Tanning and Finishing | 3.2 | 3.6 | 0.4 |
| Cheese Manufacturing | 2.4 | 2.1 | -0.3 |
| Dry, Condensed, Evaporated Dairy Product | 1.6 | 1.3 | -0.3 |
| Industrial Process Furnaces and Ovens | 1 | 1.3 | 0.3 |
| Source: QCEW 2000, 2009, 2013 Annual, MN LMI | |||
In Emerging Industries most LQs increased, which makes sense since these were selected for growth (see Table 7). The most significant changes were in motor and generator manufacturing (up 0.6) and in all other miscellaneous food manufacturing (down 0.6).
| Emerging Industries | 2009 LQ | 2013 LQ | 2009-2013 Change in LQ |
|---|---|---|---|
| All Other Miscellaneous Food Manufacturing | 3.2 | 2.6 | -0.6 |
| Motor and Generator Manufacturing | 2.7 | 3.3 | 0.6 |
| Industrial Mold Manufacturing | 1.5 | 2 | 0.5 |
| Adhesive Manufacturing | 1 | 1.4 | 0.4 |
| Fluid Milk Manufacturing | 0.5 | 0.9 | 0.4 |
| Mattress Manufacturing | 0.5 | 0.9 | 0.4 |
| Other Animal Food Manufacturing | 1.4 | 1.7 | 0.3 |
| Optical Instrument and Lens Manufacturing | 0.7 | 1 | 0.3 |
| Source: QCEW 2000, 2009, 2013 Annual, MN LMI | |||
Lagging Industries saw no significant LQ changes, in keeping with their constant employment patterns.
A few Rebound Industries saw significant increases: all other transportation equipment, metal household furniture manufacturing, fluid power pump and motor manufacturing (see Table 8). Vehicle-related manufacturing seems to be growing significantly compared with the rest of the country with the most significant and positive shifts in LQ.
| Rebound Industries | 2009 LQ | 2013 LQ | 2009-2013 Change in LQ |
|---|---|---|---|
| All Other Transportation Equipment | 8.8 | 10 | 1.2 |
| Metal Household Furniture Manufacturing | 1.3 | 2.5 | 1.2 |
| Fluid Power Pump and Motor Manufacturing | 1.2 | 1.9 | 0.7 |
| Manufactured/Mobile Home Manufacturing | 1 | 1.4 | 0.4 |
| Other Fabricated Wire Product Manufacturing | 1.3 | 1.7 | 0.4 |
| Truss Manufacturing | 1.2 | 1.5 | 0.3 |
| Wood Office Furniture Manufacturing | 0.9 | 1.2 | 0.3 |
| Source: QCEW 2000, 2009, 2013 Annual, MN LMI | |||
Manufacturing employment is on a long decline, taking with it an entire class of skilled labor. The jobs that remain and that have been growing since the recession are changing shape as well. Firms are getting smaller, and newly added jobs tend to pay less because growth trends are favoring lower-paying industries.
Growing industries are largely unrelated to declining industries. Manufacturing construction products is dramatically different from distilling liquor, and medical device workers might not be well suited for jobs producing motor homes.
The location of firms is changing, too. New growth is occurring outside of the metro areas, leaving many workers with fewer options close to home. The pace of change is relatively slow, and workers likely are adapting.