
by Alessia Leibert
September 2022
Most Minnesota workers who switched employer saw real wage gains
Coming out of the COVID-19 recession, the U.S. labor market is facing two major challenges. First, price inflation is outpacing wage growth, hurting workers by eroding their real earnings. Second, historically high voluntary quit rates1 are hurting firms while they are already struggling to fill job openings.
This study examines job mobility patterns of Minnesota workers before and after the COVID-19 recession2, with a focus on wage impacts. By adjusting wages for inflation, this study examines how job mobility interacts with inflation across different groups of workers and industries.
Job mobility is defined as the movement of workers between jobs with different employers. The analysis looks at Minnesotans3 who were employed in the fourth quarter of 2020 to see if they changed their primary employer within one year. The questions addressed are:
This study defines job mobility as a change in employer4 in the worker's dominant job5 between the baseline quarter and the same quarter one year later. Workers are categorized into three job mobility groups. The first group, labeled Stayers, consists of workers with jobs in both time periods who remained with the same employer. The second group, labeled Switchers, consists of workers who had jobs in both time periods but changed employer, either voluntarily or involuntarily. The third group, labeled Leavers, consists of workers who were employed in the fourth quarter of 2020 but were not employed in the fourth quarter of 20216. Table 1 documents the relative size of each group, comparing the period from fourth quarter 2018 to fourth quarter 2019 (pre-COVID cohort) to the period fourth quarter 2020 to fourth quarter 2021 and then first quarter 2021 to first quarter 2022 (post-COVID cohorts).
| Job Mobility Category | Pre-COVID Cohort q4 2018 to q4 2019* | Post-COVID Cohort q4 2020 to q4 2021 | Post-COVID Cohort q1 2021 to q1 2022 |
|---|---|---|---|
| STAYERS: Employed in dominant job with the same employer | 72.6% | 71.6% | 70.3% |
| SWITCHERS: Changed employer in dominant job | 18.4% | 18.1% | 18.3% |
| LEAVERS: Not employed in end quarter | 9.0% | 10.3% | 11.5% |
| Total, age 18-70** | 2,489,569 | 2,353,799 | 2,298,869 |
| *The same quarters are used over time to control for strong seasonality in Minnesota's economy.
** Individuals with no information on date of birth were excluded from the analysis. Source: Minnesota UI Wage Records merged with Minnesota Department of Public Safety's drivers' license records. |
|||
We find no difference in the relative size of the three groups except for a one percentage point decrease in the share of Stayers in both post-COVID cohorts, which was accompanied by a one percent increase in the share of Leavers. This means that more people left their employer in the post-COVID labor market compared to the period immediately preceding the pandemic outbreak, and the net result of this movement was a decline in workforce participation.
If we had measured job mobility as any job-to-job change in-between quarters instead of measuring it at two points in time we would find that the post-COVID cohort experienced slightly greater churn than the pre-COVID cohort. The average worker pre-COVID entered or reentered a job with higher frequency than the average worker post-COVID.7
Leavers are not necessarily permanent workforce dropouts: they may return to work later. The most likely to leave are the youngest and oldest workers (Figure 1). College-age workers are by far the most mobile, both in terms of switch rates (37%) and in terms of leave rates (17%). They are also the most geographically mobile and therefore may be more likely to leave Minnesota for another job or educational opportunity and not be captured in these data.
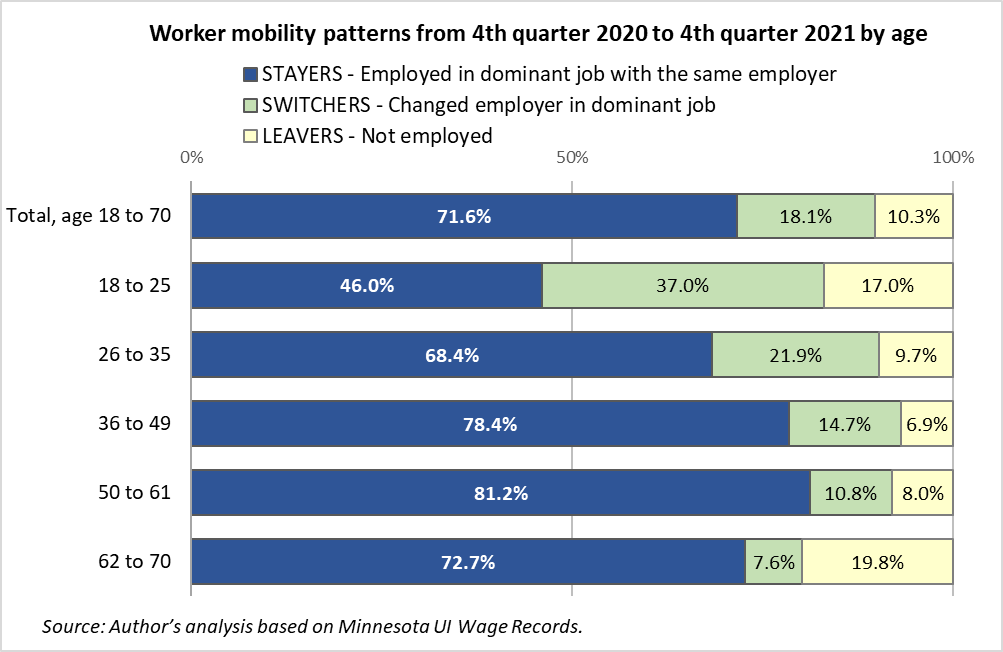
The 62 to 70 age group had the highest rate of Leavers: 20%, or one out of five workers. This rate is higher than in the pre-COVID cohort (17.5%). A similar, though less sharp, increase in the share of Leavers occurred in the 50 to 61 age group, suggesting that the pandemic triggered an acceleration in retirements.
The post-COVID labor market is characterized by high levels of inflation that have eroded earnings. The Consumer Price Index, a key inflation measure, increased by 7% in December 2021 from the year before. Real hourly earnings (wages minus inflation) fell by 1.9% from November 2020 to November 2021, the period selected for this study. However, the erosion in real earnings did not impact all categories of workers in the same way. At the median, Stayers in the post-COVID period saw an erosion in real earnings of -1%, while Stayers in the pre-COVID period posted a 1.7% over-the-year wage growth (Figure 2). Since wages that don't keep up with inflation are fundamentally a wage cut, this result means that half of Minnesotans who continued to work for the same employer experienced a pay cut. In contrast, the median worker who switched employer saw a growth of 6.1%, in line with the pre-COVID cohort. Given today's galloping inflation, a median 6.1% growth in earnings is remarkably high.
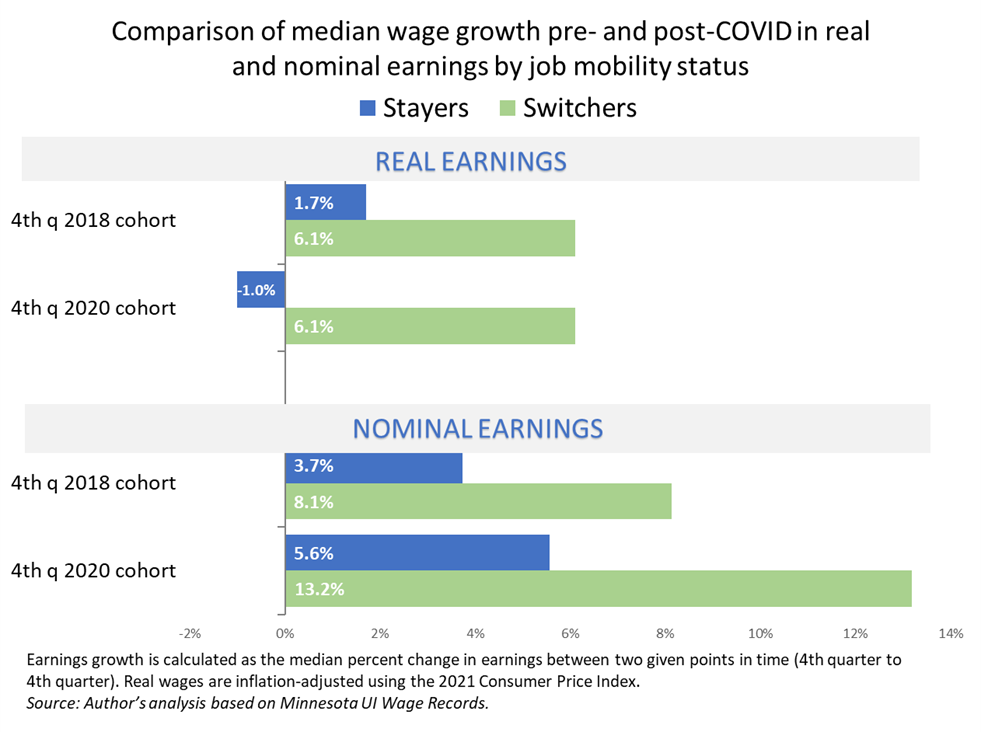
When expressed in nominal earnings (not inflation-adjusted) wage growth is still greater among Switchers but remains positive among Stayers in both cohorts. This demonstrates that the negative median real earning growth among Stayers in the fourth quarter 2020 cohort is a direct result of wages not keeping up with inflation.
From this evidence we can conclude that in Minnesota overall, in the selected quarters, job mobility trends have not changed except for a one percent increase in the share of individuals leaving the workforce. What has changed the most is the gap in wage growth between Stayers and Switchers, which became wider in the post-COVID period. If this differential continues to grow, more workers will have an economic incentive to switch, and Minnesota employers may face higher-than-typical turnover in future months.
A positive relationship between switching employer and high wage growth does not necessarily mean that higher wage growth was caused by switching employer. Based on other studies, job mobility, and wage growth from job mobility, is driven by the following key sets of factors:
Of these sets of factors, the first is the least influenced by the COVID recession. Job mobility among individuals with recently acquired skills is predominantly influenced by age and would occur even without the COVID recession. The second and third sets of factors, however, were potentially influenced by the COVID recession. The post-COVID labor market in Minnesota is characterized by historically high levels of demand for workers and low unemployment, generating the perfect conditions for workers to change employers. Inflationary pressures can further contribute to an increase in mobility if workers feel that the only way of beating inflation is to leave their current employer and move to a higher paying job. As for the choice of how many hours to work, the pandemic has changed the calculus on the part of older workers with regard to the timing of their retirement.
Figure 3 shows that Switchers (the green line) start from lower initial wages than Stayers at every age, but especially during middle age. Differences in initial wages start to narrow after age 50 as Switchers in the pre-retirement and retirement phase move to jobs that pay less and have reduced hours.
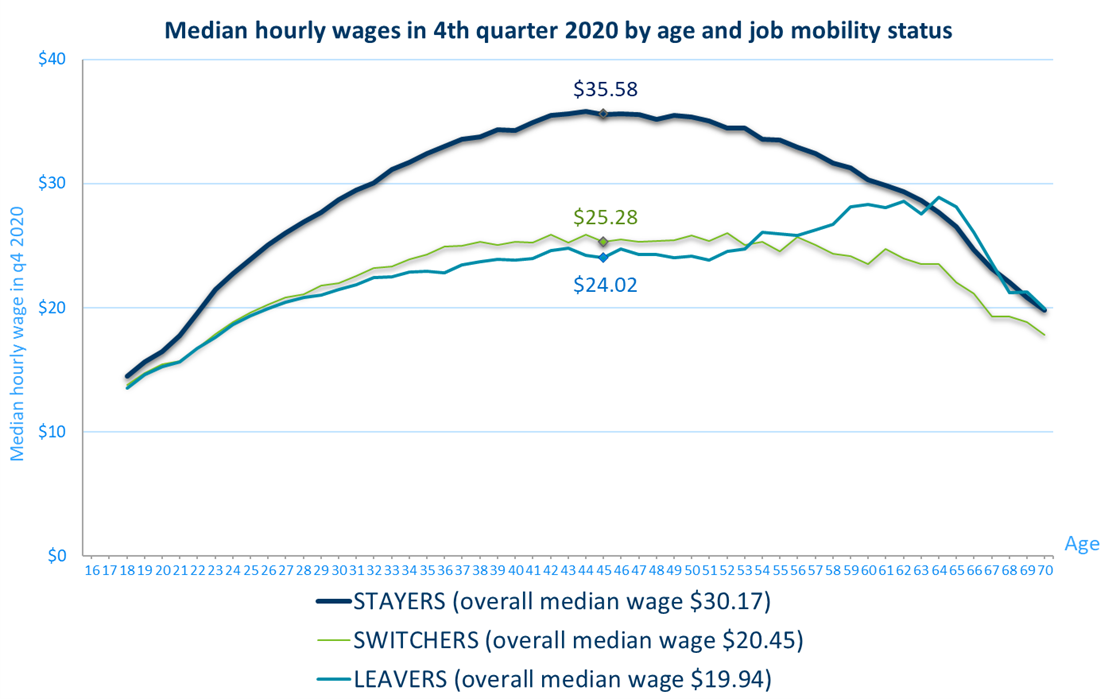
Low initial wages might have acted as a powerful incentive to switch employer. On the flip side, workers who were already in well-paid jobs in the baseline period might have had greater incentives to stay loyal to their employer.
Low initial wages might also have acted as a powerful incentive to leave the workforce altogether. Leavers, identified by the light blue line, had lower wages than Switchers until after age 56, when high-earning retirees start pulling median wages of Leavers up until they reach Stayers’ wages. Besides having lower initial earnings overall, Leavers were also more likely8 to be of college-age or retirement-age (as shown in Figure 1), although half were between age 26 and age 49; hold part-time jobs in year 2020; be employed in the Temp Help industry, or in firms that went out of business, or in small firms; file an Unemployment Insurance claim between January and August of 2020.
These findings shed light on the possible reasons why certain workers drop out of the labor market: a history of precarious, low-skilled work might be part of the reason why they could not take advantage of job switching opportunities, and their inflation-adjusted wages were too low to make it worth to continue to work. With regards to older workers, one of the possible reasons for their higher rates of Leavers could be ageism in the labor market, which puts them at a disadvantage in the search for a new job to switch to.
How did wages grow over the year from these initial earnings controlling for workers' age? And did switching employers lead to higher wage growth? Figure 4 plots wage growth as a percentage of initial earnings over the age spectrum, distinguishing between Stayers (blue line) and Switchers (green line). Wage growth, both from staying and from switching, declines steadily with age, but the median worker who switched employer saw higher real gains in earnings than those who stayed at every age.
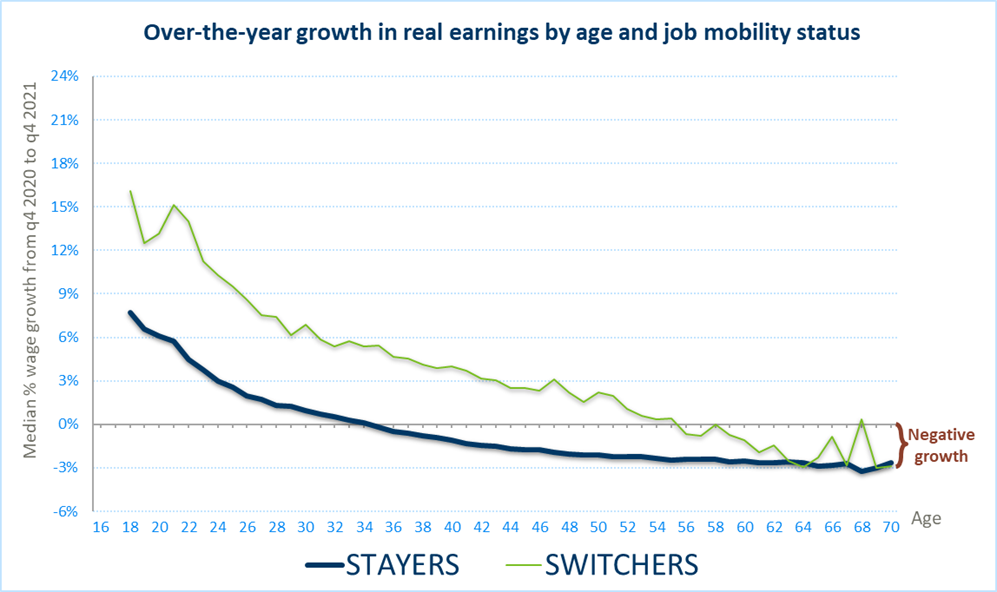
Stayers cross the zero wage growth line around age 35, while Switchers cross it at age 56. The earnings of Stayers started being eaten up by inflation at age 35, while the median Switcher was able to beat inflation until age 56.
The kink in the green line at age 21 is particularly interesting because it marks the point when college students complete a two-year degree and change occupation9. Between age 35 and 56 wage growth from switching hovers around 5% to 1%. While changes in educational attainment are more rare in this age range, changes in productivity from the simple accumulation of work experience and from increases in hours as workers switch to jobs that are more stable and offer more hours, continue to fuel wage growth. At age 56 wage growth turns into a loss in inflation-adjusted terms for Switchers.
Why is growth in median real earnings among Stayers slower than the rate of inflation? Not all employers were able, or willing, to offer pay raises to offset inflation. Some types of employers – such as small firms- may not have been able to afford company-wide salary increases. Some employers chose to adjust upwards only the wages of their new hires, as a way of easing hiring difficulties.
Let's take another look at the relationship between job mobility, age, and wage growth, this time using average rather than median growth. Figure 5 shows that switching employers is significantly more common in the youngest age group, with a switch rate of 37%, which drops to 8% in the 60 to 70 age group. On average, earnings growth from switching employers is highest in the 18 to 25 category (19.5%) and slows considerably afterwards, dropping to 4.6% among workers aged 60 to 70.
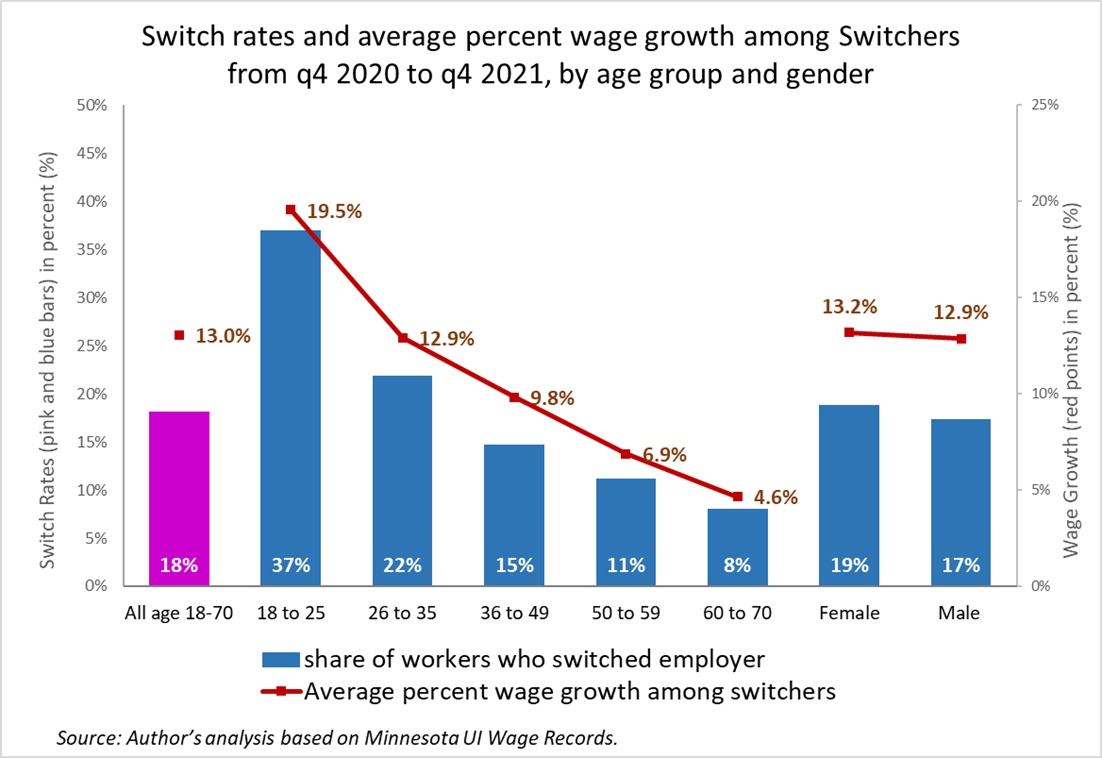
This again confirms that job mobility is much more frequent among workers who stand to gain the most in terms of wage increases; the decision to change employer has a strong economic rationale.
As mentioned earlier, changes in educational attainment among college-age individuals as well as increases in skills level from the simple accumulation of work experience and from increases in hours worked drive this stellar wage growth in the 18 to 25 category.
The age group 36 to 49 experienced slower wage growth, 9.8% on average, which in the current inflationary climate is a good outcome. Workers who switched at age 60-70 still averaged wage growth above inflation.
Finally, Figure 5 shows that female workers were slightly more likely to switch employer than males (18.8% versus 17.4%). This differential widened further in the first quarter 2021 to first quarter 2022 cohort, where the switch rate among females rose to 19.1%. Average wage growth after switching is also slightly higher among females, offering an explanation as to why females switched at higher rates. Employers might find it increasingly challenging to retain female employees in the future if switching continues to offer high returns. Not surprisingly, the most severe labor shortages in Minnesota are currently in female-dominated occupations such as nursing assistants, PCAs, teachers, childcare workers, and mental health professionals, occupations that command much lower wages than other occupations requiring comparable skills and education.
Workers with the lowest initial wages - a group that partially overlaps with the youngest age category – have a higher propensity to move across employers and stand to gain the most from such mobility, as shown by their average earnings growth of 27.8% (Figure 6). Job status is also correlated with job mobility and wage growth: part-time or seasonal workers have both the highest switch rates (29%) and the highest average wage premium from switching (18.0%).
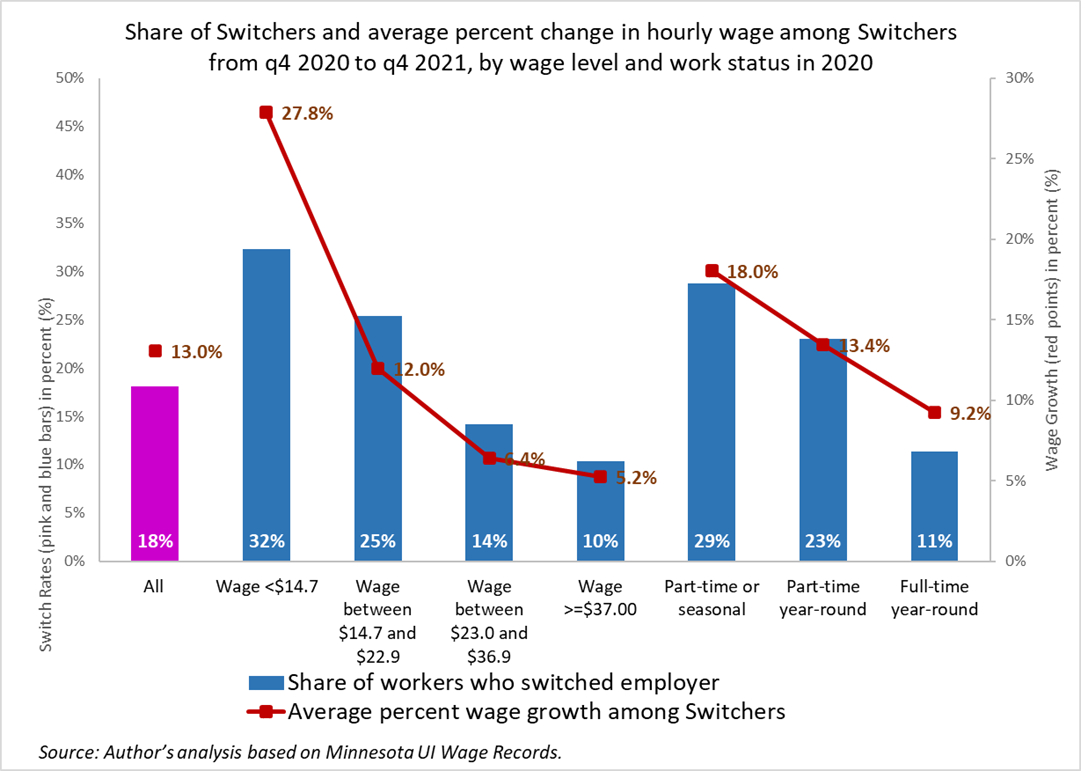
This result is a consequence of changes in labor supply that typically accompany these switches and fuel wage growth. As explained earlier, wage growth is rarely the result of switching alone. Part-time/seasonal workers have an extra capacity to increase labor supply, and this in itself can be simultaneously an incentive to switch employers and the reason for higher wage rates after switching10. An increase in hours is valuable to workers not only because of higher earnings but also because it may have been accompanied by the provision of health care benefits, paid leave, and opportunities for career advancement, all of which are elements of job quality11. In contrast, workers who hold full-time jobs may already have enough job security and opportunities for career growth within their firm to gain from staying.
One of the key factors determining which workers will switch employer is their industry sector of origin. Employers in certain industries struggle much more than others to retain employees. Figure 7 reveals stark differences in the share of Stayers, or retention rate, by industry, ranging from 86% in Government to 27% in Temp Help.
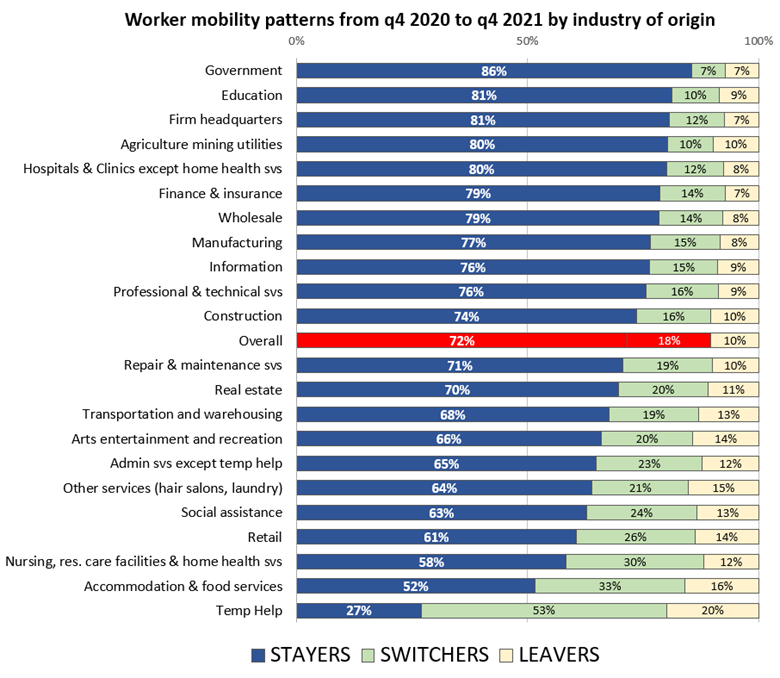
The industries at the bottom of the chart - such as Temp Help, Accommodation & Food Services, Retail and Social Assistance – offer mostly temporary, part-time and/or low-wage jobs. They tend to have a more transient workforce, such as college-age students. In these sectors, workers who leave their employer do so either because the job is of a temporary nature or because they are seeking better paid forms of employment. Not surprisingly, the majority of Switchers in these sectors leave not only their firm but the industry as a whole. The share of Switchers who also switched industry was highest in Temp Help (83.5%), followed by Retail (70%), Nursing, Residential Care Facilities & Home Health Services12 (66%), Accommodation & Food Services (62.5%), and Social Assistance (77%).
How did job mobility dynamics by industry change after the COVID-19 recession? Figure 8 compares shares of Stayers (equivalent to retention rates) pre-COVID with those post-COVID in the largest industries, revealing nearly identical patterns. The results are ranked by the share of Stayers in the post-COVID cohort. Age of the workforce is also displayed to show the correlation between age and share of Stayers: the sector with the youngest workforce, Accommodation & Food Services, had the lowest retention even before the COVID pandemic (53%), while the sector with the oldest workforce, Government, had the highest retention even before the pandemic.
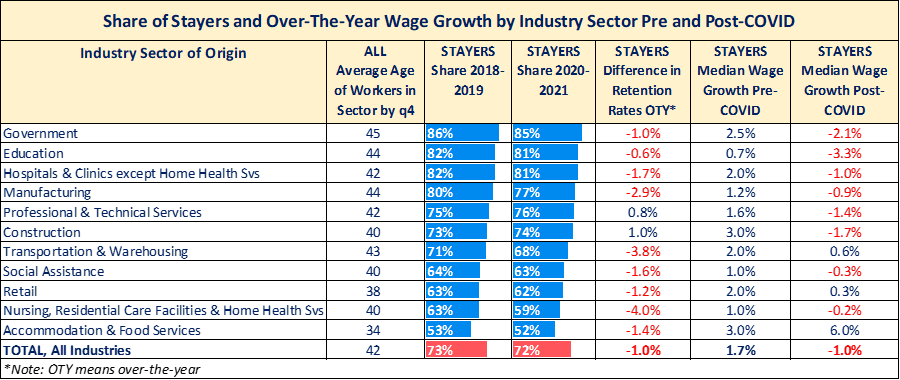
The comparative advantage from switching versus staying varies widely by industry. Workers remain longer with their employer in industries that offer relatively more job stability, more bargaining power (often thanks to unions), and career advancement opportunities tied to tenure, with larger firms providing more such opportunities than smaller firms. As long as these structural and institutional factors in an industry remain the same (average age of the workforce, average firm size in a sector, level of unionization, role of tenure in fueling wage growth) job mobility dynamics won't change significantly over time.
There are, however, a few notable changes in mobility patterns from the pre-COVID period. The effects of the pandemic were uneven, resulting in some industries suffering more long-term effects than others. Only two sectors, Professional & Technical Services and Construction, experienced an increase in over-the-year retention from the pre-pandemic period, probably because they emerged stronger in terms of profitability and capacity to invest in employee retention. At the other end of the spectrum, Nursing & Residential Care Facilities suffered a loss of -4 percentage points in the share of Stayers relative to pre-COVID levels. This loss was larger than in Retail despite the older average workforce in Nursing & Residential Care Facilities. This is an example of market factors prevailing over structural factors: employers in this industry are losing competitiveness in the talent race as a direct consequence of this industry's high toll from the pandemic, including worker burnout.
There are also industries that were hit very hard by the recession but rebounded quite well during the recovery. Accommodation & Food Services, for example, experienced a significant rebound thanks to pent-up demand for vacationing and dining out. This fueled larger-than-typical wage growth not only in entry-level but also in existing jobs, as we can see from a 6% median wage growth among Stayers. These favorable market demand conditions allowed employers to work to retain employees, holding on to a retention rate of 52%. This is extremely good news for employers and workers in this sector.
Are employers more at risk of losing employees when wage growth among Stayers is negative? Figure 8 shows that median wage growth is lower overall in the post-COVID than in the pre-COVID labor market, and we know this to be a consequence of inflation. But the effect was uneven across industries, and age was not the only factor driving this result. Wage growth dipped in two industries more than others, Education and Government. High levels of unionization do not protect workers from rapidly growing inflation because new contracts are signed every two years or even less frequently. The large erosion in the real earnings of Stayers in Education (-3.3%), if not addressed, is likely to push more teachers to leave the profession, exacerbating current labor shortages.
Another sector where some employers might suffer from a decline in retention is Manufacturing, one of the largest sectors in Minnesota. This sector had a high median hourly wage among Stayers, $29.80 in fourth quarter 2020, hinting at good internal career advancement opportunities that should help with retention. However, wage growth among Stayers was slightly eroded by inflation, with a loss of -0.9%. Perhaps because of this, employee retention dropped by nearly three percentage points (-2.9%) from the pre-COVID period. The greatest risk in this sector is for skilled workers to move between manufacturers as a result of recruitment, a phenomenon called poaching. Employers that don't adjust the wages of their current employees to offset inflation risk lower retention of skilled workers.
This article examined job mobility patterns in the post-COVID labor market. Key findings are summarized below.
These findings strongly suggest that the phenomenon of switching employer is driven by the rational decision of seizing the opportunity to earn a better wage. The post-COVID labor market, with job vacancies at a historic high, offers much needed respite and opportunity for upward economic mobility to the lowest paid workers, the same workers who suffered the most from the COVID-19 recession13. At the same time, however, not all workers in dire need of improved earnings had the opportunity to do so by changing employer. Further research is needed to understand what might be preventing these workers from moving out of low-wage work.
1In Minnesota, voluntary quit rates in 2021 and 2022 were generally higher than in 2019. Source: U.S. Bureau of Labor Statistics quits rates data.
2In this article, these time periods are referred to as pre-COVID and post-COVID.
3The main condition for inclusion in the study is having a match with drivers' license records from the Minnesota Department of Public Safety. This represents 90% of individuals in UI wage records.
4This is the most common measure of job mobility. It captures only movements across firms (external job mobility) rather than also movements within a firm (internal job mobility). By firm we mean an employer account, not its individual establishment. A worker who changed jobs from one location of a restaurant to a different location of the same restaurant, or from a manufacturing branch to a wholesale branch of the same employer does not qualify as job mobility in our study.
5Dominant job is defined as the job with the highest quarterly wages.
6Workers who took a job outside of Minnesota or became self-employed also fall into this category since this analysis is based on Minnesota U.I. covered employment data only.
7The average worker in the pre-COVID cohort started a new job, or was re-hired in a job after an interruption, 8% of the time they were employed, while the average worker in the post-COVID cohort changed 12% of the time they were employed. In other words, the average worker pre-COVID entered or reentered a job with higher frequency than the average worker post-COVID.
8The likelihood of not being employed in 4th quarter 2021 was measured through a logistic regression model which included the following variables: gender, age, location of work, firm size, industry sector, employment status in 2020, hourly earnings quartile in 2020, UI claimant status in January-August 2020, and number of UI weeks claimed. All sets of variables reached statistical significance. The model was robust to changes in specification, including restricting the analysis to workers age 26 to 54.
9The kink in the graph is more pronounced among female workers at around age 21, when many of them moved from jobs in Accommodation & food services to jobs in Health care, suggesting that they might have completed an Associate's degree in Registered Nursing or an LPN certificate. For an analysis of wage growth among Registered Nursing graduates see Leibert, Alessia The Geographic Mobility of New Nursing Grads, January 2014, MN Employment Review
10The average annual increase in work hours in the dominant job among Switchers was 6% versus 0.4% among Stayers. Among workers who were employed part-time or seasonally and who switched employer, the average annual increase in work hours in the dominant job was very high, 33%.
11The number of workers working part-time for economic reasons has been declining over the last 2 years and, as of summer 2022, is at an all-time low. Most workers who want to work full-time are finding full-time work in the current labor market.
12NAICS code 623 (Nursing & Residential Care Facilities) was combined with NAICS code 621610 (Home health services) because most of the occupations found in the first industry are also found in the second. The skills and education level of jobs in the two industries are very similar.
13See Leibert, Alessia, Reemployment After COVID-19 Layoffs in Minnesota: Who's Getting Left Behind? March 2022 - MN Economic Trends