by Luke Greiner
April 2018

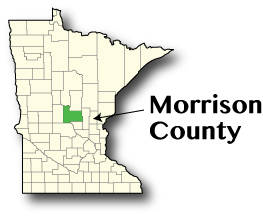
Established in 1856, Morrison County proclaims itself to be the gateway to Minnesota's northern cabin country. With 1,125 square miles Morrison County is the 17th largest county in the state. The county was home to Charles Lindbergh, who lived in Little Falls for 20 years before going on to complete the first solo, non-stop transatlantic flight. The recently discovered remains of Ft. Duquesne, a former French fur trading outpost, is situated along the Mississippi River just north of Little Falls. The county is also home to Camp Ripley, a 54,000 acre year-round training facility used by the National Guard, United States Army Reserve, and other active military units across the entire United States and Norway.1
Despite a slow but steady population growth trend (38th fastest of 87 counties) since 2000, the county's population is expected to stagnate and decline 0.6 percent through 2040. This nearly stable population projection creates a negative labor force projection to 2030, mainly caused by the further aging of an already older-than-typical labor force. However, since the county benefits from being the gateway to Minnesota's northern recreation hotspots, it could be positioned to take advantage of an increasing number of retirees commuting to vacation homes in the region.
Although the county has consistently added residents over the last 15 years, the labor force had 500 fewer workers in 2017 than the peak in 2011. The tightening labor force combined with an expanding economy to create a decreasing unemployment rate, averaging 5.5 percent in 2017.
Employment levels, however, have been inconsistent. Despite some positive growth years in 2008, 2011, and again in 2015 and 2016, the 10,899 jobs posted in 2016 are fewer than what was reported a decade prior. The largest industry in the county is the Education and Health Services sector with 2,400 jobs at 108 establishments. The industry gained jobs throughout the recession but then lost jobs from 2011 to 2014. The second largest industry, Trade, Transportation, and Utilities, remains well below the prerecession high of 2,556 jobs. However, in spite of the last recession, Retail Trade employment has been relatively stable and remains just 87 jobs short of the previous peak in 2008. The third largest industry was Leisure and Hospitality with 1,202 jobs in the third quarter of 2017. Although job levels have fluctuated since 2000, the last two years are trending upwards.
| Economy | ||
|---|---|---|
| 2017 Estimates | Morrison County | Minnesota |
| Population | 33,064 | 5,576,606 |
| Labor Force | 17,811 | 3,063,604 |
| Average Unemployment | 5.5% | 3.5% |
| Median Household Income (2016) | 51,456 | 63,217 |
| Cost of Living, Individual (2018) | 29,026 | 31,656 |
| Cost of Living, Average Family (2018) | 49,195 | 57,624 |
| Source: U.S. Census Bureau, LAUS, American Community Survey, DEED Cost of Living | ||
| Morrison County Employment | |||||
|---|---|---|---|---|---|
| Top Employing Industries | Number of Firms | Number of Jobs | Average Wage | Change in Jobs | Change in Wages |
| Total All Industries | 942 | 10,838 | 36,868 | -534 | 7,176 |
| Education and Health Services | 108 | 2,400 | 39,104 | 330 | 8,580 |
| Trade, Transportation, and Utilities | 204 | 2,303 | 31,356 | -172 | 6,760 |
| Leisure and Hospitality | 119 | 1,202 | 13,000 | 66 | 3,536 |
| Public Administration | 40 | 1,099 | 55,068 | 126 | 8,412 |
| Source: DEED, Quarterly Census of Employment and Wages | |||||
1Retrieved from Morrison County

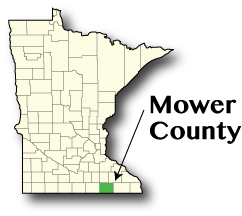
On March 1, 1856, Mower County was established with the signature of Governor Willis A. Gorman. The name "Mower" was selected to honor John E. Mower, a territorial legislator. Frankford was the where the first Board of Commissioners met and was likely to be the county seat. But with no county building and documents secured only in a tin box, the box was stolen and moved to Austin and thus Austin became the county seat. What started out as a small frontier county eventually had over 48,000 residents by 1960. Since then the population declined and then stabilized at just fewer than 40,000 people in 2017.
Like many counties in Minnesota, Mower is expected to have fewer residents in the future than today. By 2040 the projected population is 36,836, 5.5 percent less than its projected population in 2020. Although an overall decline is expected, growth within certain age groups should occur, specifically people 75 years or older. Historically low unemployment rates combined with a decreasing labor force projection mean that employers should expect current tight labor market conditions to persist into the foreseeable future.
Mower County has enjoyed positive employment growth since the last recession ended. By the third quarter of 2017 the county had 16,567 jobs, 254 more jobs than it did in 2007, and set a new record high. Average annual wages in the county grew dramatically from 2007 to 2017, amounting to a 45 percent increase.
Mower, like many counties in Minnesota, had more jobs in the Education and Health Services industry than any other, nearly one-quarter of total employment. The industry has also proved to be a source of jobs throughout the recession and since 2011 has been on the rise. With a large Nursing and Residential Care component, the Healthcare sector has been experiencing substantial growth in the last few years, partly from an older population relative to the state. The labor market is tight in Mower County with some of the lowest unemployment rates in the state, most recently 2.9 percent for 2017, more than a half point lower than Minnesota.
Although Manufacturing has significantly fewer jobs than it did around the turn of the century, it remains Mower County's second largest industry with 3,640 jobs in 2016. The industry also has a good median wage at $18.52 per hour, more than $5 higher than the median hourly wage for all jobs in the county. The vast majority – 90 percent – of Manufacturing jobs are in the Food Manufacturing subsector.
| Economy | ||
|---|---|---|
| 2017 Estimates | Mower County | Minnesota |
| Population | 39,566 | 5,576,606 |
| Labor Force | 20,595 | 3,063,604 |
| Average Unemployment | 2.9% | 3.5% |
| Median Household Income (2016) | 51,778 | 63,217 |
| Cost of Living, Individual (2018) | 26,986 | 31,656 |
| Cost of Living, Average Family (2018) | 46,721 | 57,624 |
| Source: U.S. Census Bureau, LAUS, American Community Survey, DEED Cost of Living | ||
| Mower County Employment | |||||
|---|---|---|---|---|---|
| Top Employing Industries | Number of Firms | Number of Jobs | Average Wage | Change in Jobs | Change in Wages |
| Total All Industries | 839 | 16,567 | 46,696 | 254 | 14,352 |
| Education and Health Services | 99 | 4,058 | 43,524 | 274 | 11,804 |
| Trade, Transportation, and Utilities | 34 | 3,740 | 51,324 | -91 | 9,620 |
| Leisure and Hospitality | 198 | 2,934 | 41,028 | -79 | 17,524 |
| Public Administration | 78 | 1,966 | 82,992 | 513 | 30,264 |
| Source: DEED, Quarterly Census of Employment and Wages | |||||
2Retrieved from Mower County

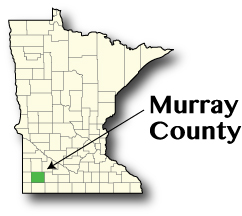
Established in 1857 and formally organized in 1872, Murray County's original county seat, Currie, was changed to Slayton after a contentious battle in 1890. Philander Prescott was the first European to visit the area in 1831, and the first white immigrants settled around Lake Shetek
The first F5 tornado in Minnesota's history tragically struck the small town of Tracy after tracking through Murray County in 1968, killing nine people and injuring 125 more.3
Currently holding as the 75th largest (or 13th smallest) county of 87 in the state, Murray County has declined in population by 44 percent since 1950, making a small county even smaller. Recent trends show more of the same, resulting in a declining labor force, estimated at 4,850 in 2017. The county had roughly 900 fewer workers in 2017 compared to 2009. Unemployment in the county, however, is high for the region and has remained above the state average since 2013. This "slack" means employers still have willing workers who can contribute to the local economy.
Despite a population decline, Murray County experienced exceptional job growth throughout the recession, experiencing only a single year of decline in 2007 and even then losing just 39 jobs. From the third quarter of 2007 to 2017, total employment grew by 8.4 percent by adding 232 net new jobs. Most of the gains were found in the Manufacturing sector, the third largest industry in the county with 510 jobs at nine establishments. While most regions have yet to reach pre-recession employment in the Manufacturing industry, manufacturers in Murray County nearly doubled employment since 2007.
The largest industry in 2017 was Trade, Transportation, and Utilities with 761 jobs at 95 business establishments. Thanks to a strong Manufacturing and Agriculture economy in the county throughout the recession, the Retail Trade subsector only recently shed a small number of jobs but remains at the same level as the previous peak in 2009, with 348 jobs in 2017.
| Economy | ||
|---|---|---|
| 2017 Estimates | Murray County | Minnesota |
| Population | 8,346 | 5,576,606 |
| Labor Force | 4,850 | 3,063,604 |
| Average Unemployment | 4.6% | 3.5% |
| Median Household Income (2016) | 51,801 | 63,217 |
| Cost of Living, Individual (2018) | 27,961 | 31,656 |
| Cost of Living, Average Family (2018) | 46,138 | 57,624 |
| Source: U.S. Census Bureau, LAUS, American Community Survey, DEED Cost of Living | ||
| Murray County Employment | |||||
|---|---|---|---|---|---|
| Top Employing Industries | Number of Firms | Number of Jobs | Average Wage | Change in Jobs | Change in Wages |
| Total All Industries | 323 | 2,994 | 34,788 | 232 | 9,464 |
| Education and Health Services | 95 | 761 | 36,556 | 116 | 11,232 |
| Trade, Transportation, and Utilities | 23 | 629 | 34,788 | -37 | 8,528 |
| Leisure and Hospitality | 9 | 510 | 34,268 | 246 | 8,060 |
| Public Administration | 32 | 227 | 14,560 | -21 | 6,188 |
| Source: DEED, Quarterly Census of Employment and Wages | |||||

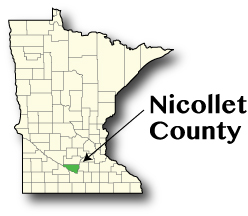
Named after the French explorer Joseph N. Nicollet, Nicollet County makes up the northern part of the North Mankato - Mankato Metropolitan Statistical Area, along with Blue Earth County. The county is mainly farmland, but also contains 24,000 acres of forest and 12,000 acres of wetland.
Early in the state's history, the Minnesota capitol was to be moved from St. Paul to St. Peter, but the bill to make the change disappeared. The county seat, however, moved to St. Peter in 1856.
Nicollet County looks to be positioned well for the future. With the 22nd fastest growing population in the state from 2000 to 2016, a larger concentration of younger residents, and positive population projections, Nicollet County should be able to grow its economic base as employers keep a keen eye on labor force availability. Although the labor force is actually expected to decline slightly from 2020 to 2030, the positive population projection and recent labor force growth trend should at least allow employment to recover fully from the losses incurred during the recession.
Employment in the county took a tumble during the recession and hasn't been able to correct the losses. From 2006 to 2010 almost 1,700 jobs vanished as employment decreased by 11.5 percent. The largest loss occurred in the Manufacturing industry where 1,248 jobs were shed in the four-year period, meaning over a quarter of Manufacturing jobs in the county disappeared. Since then the rebound in Manufacturing has been positive, with 294 jobs added from the third quarter of 2010 to 2017.
The Education and Health Services industry is the largest sector in terms of employment with 3,886 jobs in 2017. Growth has been consistent since 2008, enabling the sector to increase its share of total employment to 27 percent.
Despite not recovering from the Great Recession, Manufacturing remains the second largest industry by a close margin, heavy on Printing and Related Support activities, with 2,065 jobs.
| Economy | ||
|---|---|---|
| 2017 Estimates | Nicollet County | Minnesota |
| Population | 33,966 | 5,576,606 |
| Labor Force | 20,469 | 3,063,604 |
| Average Unemployment | 2.7% | 3.5% |
| Median Household Income (2016) | 61,501 | 63,217 |
| Cost of Living, Individual (2018) | 28,612 | 31,656 |
| Cost of Living, Average Family (2018) | 47,338 | 57,624 |
| Source: U.S. Census Bureau, LAUS, American Community Survey, DEED Cost of Living | ||
| Nicollet County Employment | |||||
|---|---|---|---|---|---|
| Top Employing Industries | Number of Firms | Number of Jobs | Average Wage | Change in Jobs | Change in Wages |
| Total All Industries | 728 | 14,724 | 42,484 | 109 | 9,932 |
| Education and Health Services | 105 | 3,886 | 43,940 | 603 | 6,188 |
| Trade, Transportation, and Utilities | 61 | 3,867 | 45,032 | -1,250 | 10,088 |
| Leisure and Hospitality | 144 | 2,324 | 37,180 | 540 | 8,216 |
| Public Administration | 75 | 992 | 53,768 | -80 | 20,228 |
| Source: DEED, Quarterly Census of Employment and Wages | |||||