By Luke Greiner
June 2015
The Central Minnesota region is generating new jobs at a faster pace than anywhere in the state.
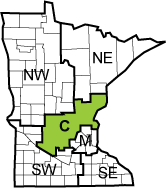
 Central Minnesota has more jobs than any region outside of the Twin Cities. The 13-county planning area accounts for about one in every 10 jobs in the state, with 265,861 jobs at 17,070 business establishments as of third quarter 2014.
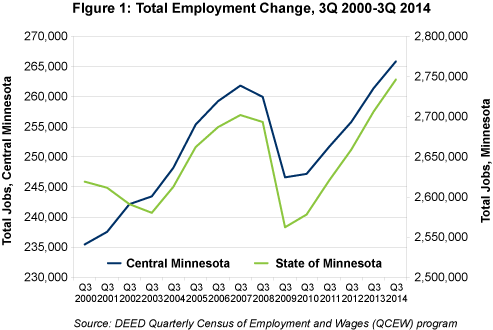
Central Minnesota is unmatched when it comes to job growth in the state. Employers in Central Minnesota expanded by 11.2 percent from 2000 to 2007, which was more than three times as fast as the state overall and twice the pace of the next fastest-growing region.
The region, however, also suffered a bigger job decline than the state during the Great Recession from 2007 to 2009. Central Minnesota fell from its pre-recession peak employment level of 261,864 jobs in third quarter 2007 to a low of 246,545 jobs in third quarter 2009. During that period, the region's total employment decreased 5.8 percent, compared with the state's 5.2 percent loss.
Since those harsh economic times, Central Minnesota is once again leading the state in job growth. By 2013 it had regained all the jobs lost in the recession. In third quarter 2014, the region had nearly 4,000 more jobs than its pre-recession peak. Since 2009, the region has had the state's fastest rate of job growth (see Figure 1).

Central Minnesota experienced just three years of negative job growth in the last decade and a half. Instead, consistent annual job gains combined with higher rates of growth during periods of economic expansion allowed Central Minnesota to add jobs 2-1/2 times faster than the state from 2000 to 2014.
Although the region's industry concentration is somewhat similar to the rest of the state, Central Minnesota has benefited recently from strong growth in its top three employing industries: health care and social assistance, manufacturing and retail trade. Together, those three industries provide almost half of the jobs in the region, accounting for just over 125,000 jobs in third quarter 2014.
Central Minnesota industries have experienced mixed employment changes in recent years, with 14 of the 20 main sectors shedding jobs during the recession, but 18 of 20 adding jobs throughout the recovery. So far, eight industry sectors have managed to surpass their pre-recession employment levels as of third quarter 2014.
Health care and social assistance overtook manufacturing as the largest employing industry in 2008, as the two industries moved in different directions during the recession. After gaining more than 5,600 jobs since third quarter 2007 - including nearly 3,000 new jobs from 2007 to 2009 - health care and social assistance had 48,159 jobs as of third quarter 2014.
In contrast, despite solid job gains and an impressive 14 percent growth rate during the recovery, manufacturing employment is still well below its pre-recession level. After cutting more than 7,300 jobs from 2007 to 2009, manufacturing has maintained stable employment growth since 2011, even doubling the growth rate for all industries. If manufacturing continues adding jobs at the same rate, it could be fully recovered in the next year.
Educational services has been another solid performer throughout the recession and recovery. By adding more than 1,700 jobs from 2007 to 2014, the region's elementary, secondary and postsecondary schools contributed the second-largest number of net new jobs in Central Minnesota.
Like manufacturing, the other industries hit hardest during the recession have either recovered or are on the verge of breaking even. Construction shed more than 3,400 jobs from 2007 to 2009, but the industry has now rebuilt payrolls by almost 3,550 net new jobs, leaving the region up by 129 construction jobs from 2007 to 2014.
Retail trade along with accommodation and food services lost nearly 4,000 jobs combined during the recession, but they have welcomed back about 3,275 jobs in the past five years, leaving both industries just below their pre-recessionary employment levels.
The administrative support and waste management services industry also suffered the ups and downs of the recession, slicing 1,721 jobs from 2007 to 2009 before gaining back 1,893 jobs from 2009 to 2014 (see Table 1).
| Central Minnesota Industry Employment Statistics, Q3 2007 - Q3 2014 | ||||||
|---|---|---|---|---|---|---|
| NAICS Industry Title | Number of Firms Q3 2014 | Number of Jobs Q3 2014 | Quarterly Payroll Q3 2014 | Recession | Recovery | Total |
| Change in Jobs Q3 2007 - Q3 2009 | Change in Jobs Q3 2009 - Q3 2014 | Change in Jobs Q3 2007 -Q3 2014 | ||||
| Total, All Industries | 17,070 | 265,861 | $2,521,194,456 | -15,319 | +19,316 | +3,997 |
| Agriculture, Forestry, Fishing and Hunting | 425 | 4,601 | $34,391,666 | 0 | +412 | +412 |
| Mining | 28 | 348 | $4,922,181 | -70 | -2 | -72 |
| Construction | 2,666 | 17,947 | $246,923,923 | -3,419 | +3,548 | +129 |
| Manufacturing | 1,172 | 41,689 | $483,707,452 | -7,315 | +5,177 | -2,138 |
| Utilities | 59 | 2,631 | $54,274,390 | -117 | +50 | -67 |
| Wholesale Trade | 694 | 9,710 | $119,776,310 | -358 | +168 | -190 |
| Retail Trade | 2,332 | 35,154 | $216,682,409 | -2,355 | +1,951 | -404 |
| Transportation and Warehousing | 826 | 8,635 | $88,464,834 | -380 | +642 | +262 |
| Information | 229 | 3,372 | $35,758,718 | -467 | +169 | -298 |
| Finance and Insurance | 816 | 6,546 | $79,828,794 | -625 | -256 | -881 |
| * Real Estate, Rental and Leasing | 531 | 2,204 | $15,394,585 | -183 | +50 | -133 |
| Professional, Scientific, and Technical Services | 1,066 | 5,424 | $64,850,693 | +169 | +50 | -262 |
| Management of Companies and Enterprises | 58 | 1,518 | $23,787,560 | +193 | +210 | -133 |
| Admin. and Support and Waste Mgmt. Services | 758 | 10,276 | $73,548,514 | -1,721 | +1,893 | +172 |
| Educational Services | 322 | 18,879 | $204,422,242 | +787 | +927 | +1,714 |
| Health Care and Social Assistance | 1,426 | 48,159 | $488,066,443 | +2,729 | +2,947 | +5,676 |
| * Arts, Entertainment, and Recreation | 331 | 5,233 | $22,988,631 | -343 | -119 | -462 |
| * Accommodation and Food Services | 1,216 | 22,772 | $80,307,853 | -1,588 | +1,323 | -265 |
| Other Services | 1,665 | 8,011 | $45,079,145 | +201 | +310 | +511 |
| Public Administration | 450 | 12,746 | $138,018,113 | -258 | +424 | +166 |
| Source: DEED, Quarterly Census of Employment and Wages (QCEW) program | ||||||
| * Private sector data only | ||||||
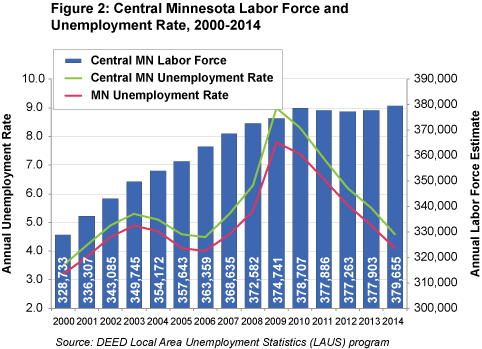
Conversations about labor have changed dramatically in the past few years as the workforce has shifted from a surplus of unemployed workers to a tightening labor market. After adding nearly 50,000 new workers from 2000 to 2010 - a 15.2 percent growth rate for the decade - Central Minnesota's labor force has leveled out so far this decade, gaining fewer than 1,000 workers from 2010 to 2014.
In the last decade, Central Minnesota accounted for about 40 percent of the total labor force growth in the state. The state's labor force has grown faster since 2010, with Central Minnesota seeing two year-over-year declines, falling from 378,707 available workers in 2010 to 377,263 workers in 2012. Central Minnesota has provided less than 3 percent of the state's labor force growth since 2010.
Despite slower growth in recent years, Central Minnesota's labor force continues to edge higher, with a record 379,655 workers in 2014, or 948 more than the previous peak in 2010.
Unemployment rates in Central Minnesota have been higher than the state for the last 14 years, regardless of how the economy is doing. Because of the faster rate of job loss in the region, unemployment spiked much higher in Central Minnesota than the state during the recession, climbing to 9 percent in 2009. The region's unemployment rate declined faster during the recovery, however. By 2014, it matched the region's pre-recession rate of 4.6 percent (see Figure 2).

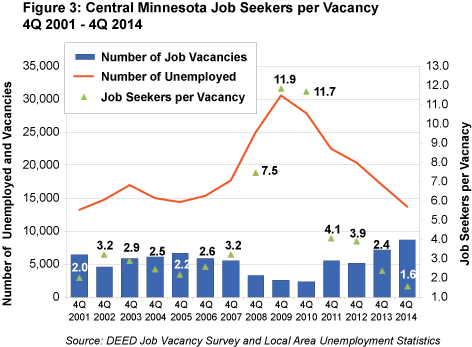
The current economic expansion, when coupled with the slowing labor force growth rate due to demographic shifts, leaves little wiggle room for companies competing for labor in Central Minnesota. With just 1.6 job seekers for every job vacancy in the most recent period, it is easy to understand why many local businesses are struggling to fill open jobs.
Job Vacancy Survey data from the fourth quarter of 2014 show there were 8,685 job vacancies in the region, the highest number on record. That figure was more than triple the hiring activity in 2010, when job openings bottomed out at 2,394.
In comparison, there were 13,787 unemployed job seekers in the region during fourth quarter 2014, which was less than half of the 30,610 unemployed workers during fourth quarter 2009. In that period of high unemployment and low job vacancies, Central Minnesota had nearly 12 unemployed job seekers for every job opening (see Figure 3).

With a slightly higher unemployment rate and a rapidly growing business community, Central Minnesota has just enough labor market slack to not only keep the regional economy afloat, but keep it moving full steam ahead.