
by Alessia Leibert
March 2022
Printable PDF Version of the Article
Among Minnesota workers laid off during the initial months of the pandemic, who regained employment most quickly? And who suffered the most time out of work and experienced the greatest loss of wages? This article seeks to answer those questions and others by examining spring 2021 employment status of Minnesotans eligible for Unemployment Insurance who filed for benefits in the initial months of the pandemic. It shows that more than three-quarters of those laid off were working in spring 2021. But it also shows a two-tiered recovery with workers who are Black, over age 55, or who have low educational attainment being the most likely to suffer long-term unemployment and significant wage loss.
From March to August 2020, 631,040 Minnesotans eligible for Unemployment Insurance (UI) filed for benefits1. That is 20% of Minnesota's workforce. This study presents the most up-to-date information we have about their employment status. Specifically, this study considers how many and which workers fell into the following categories during spring 2021:
This information helps identify who is being impacted the most in terms of job and demographic characteristics, and which segments of the economy (industries, occupations) are on the path to recovery and which ones are still struggling.
Table 1 summarizes the net results of movements in and out of employment from the base period to spring 2021 for these 631,040 claimants2.
Table 1
| - | Workers who requested UI benefits from March to June 2020 by employment status in spring 2021 | Percent of total UI claimants | Percent who requested UI benefits again in July-Sept. 2021 | Median weeks of UI claimed before July 2021 | Average difference in quarterly wages between pre- layoff and post-layoff* | Percent workers whose hourly wages** fell by >=10% |
|---|---|---|---|---|---|---|
| EMPLOYED | Employed by same employer(s) that laid them off (Group 1)
N= 307,672 |
49% | 10% | 11 | -$297 | 12% |
| Working in second job***(Group 2)
N= 35,875 |
6% | 14% | 14 | -$360 | 17% | |
| Changed employer
(Group 3) N= 137,964 |
22% | 14% | 18 | -$368 | 25% | |
| NOT EMPLOYED | Requesting UI benefits, not employed
(Group 4) N= 80,393 |
13% | 87% | 62 | NA | NA |
| Not employed and not requesting UI benefits (Group 5)
N= 69,778 |
11% | 0% | 14 | NA | NA | |
| - | Total N=631,040**** | 100% | 20% | 16 | -$322 | 16% |
| *The pre-layoff period is defined as the period from summer (q3) 2019 to winter (q1) 2020. The post-layoff period corresponds to q2 2021.
**Hourly wages represent jobs with valid reported hours and were calculated across all jobs held, not only in the jobs that were lost. ***This group represents claimants who were working multiple jobs before the pandemic and returned to one of these jobs in q2 2021. Furthermore, this group includes 9,426 claimants with missing employer information and who, therefore, could not be included in Group 1. ****Representing distinct (unduplicated) claimants who were monetarily eligible for UI benefits and were employed in the period q3 2019-q1 2020. Source: Author's calculations based on MN PROMIS file and MN UI wage records |
||||||
The key take-away from this analysis is that 77% (49%+6%+22%) were employed in the spring of 2021. Most of them (the first group in Table 1, comprising 49% of the total) had returned to the same employer who had laid them off. Fewer broken bonds between employee and employer are good news for the recovery. From March 2020 these workers had the shortest spells of unemployment compared to any other group, a median of 11 weeks. The fact that 10% of these workers filed for UI again between July and Sept 2021 suggests that the remaining 90% continued to work in that period.
The other good news is that hours and earnings losses for this group were very mild. Quarterly wages, representing earnings from all jobs held in spring 2021, decreased by an average of $297 compared to the pre-covid period, likely because some second jobs were lost forever. Another indicator of the mild impact of the COVID-19 recession on this group of claimants is the very small share, 12%, who suffered a pay cut greater than 10% of their pre-pandemic wage. This suggests that the overwhelming majority were called back at the same wage and kept the same job role.
Workers in Group 2 did not go back to the employer that laid them off but instead found reemployment with other employers with whom they had ties prior to the pandemic. The median duration of unemployment, 14 weeks, was a bit higher in this group compared to the first, and not surprisingly the wage penalty was also higher because of foregone hours3 (an average loss of $360 in quarterly earnings). Furthermore, 17% of workers in Group 2 experienced a wage loss greater than 10% of their pre-pandemic wage, suggesting that one out of five may not have returned to their highest skilled job role or occupation. These losses are milder relative to those measured in summer 2020 (and documented in this study), indicating that more workers returned to previous roles or pay levels by summer 2021.
Workers in Group 3, representing 22% of the total, found a new employer. Since these workers started from a lower earnings level than workers in Group 2, as a group they had a similar average loss in wages in absolute terms ($368 versus $360) but in relative terms they fared much worse. In fact, 25% of workers in this group suffered a wage loss greater than 10% of their pre-pandemic hourly wage. This is not surprising given the fact that breaks in employee-employer bonds often push workers to accept job offers at a lower salary than pre-layoff.
Workers in Group 4, representing 13% (80,393) of the total, were not working during spring 2021 and were requesting UI benefits. Fortunately, this is down from summer 2020 when this group represented 133,115 people, but these workers are at high risk of prolonged unemployment. These workers may have worked sometime between July 2020 and February 2021, but they were not working during second quarter 2021. A median of 62 weeks of unemployment by July 2021 implies that one half filed for less than that, likely because they were working. Nearly nine out of ten (86%) continued to request benefits in July-September of 2021. As we will see later in the article, workers in this group had the lowest wages before the pandemic and are therefore the least likely to have savings or investment income to tide them over.
The last group, Group 5, representing 11% of the total, is harder to interpret. Some of these individuals may have chosen to retire4 in this group. Some may have stopped filing because they were discouraged by lack of job prospects (also likely older workers) or became ineligible. Some may have found other sources of income including self-employment, which is not captured in these data. Moreover, some may have taken jobs outside of Minnesota and a small share died.
Of the five groups, Group 4 is bearing the worst brunt of the pandemic recession. Of these 80,000 workers, one out of six were laid off from the Accommodation & Food Services sector. The prospects of returning to work might have been hurt by these workers' inability to transfer to other industries. Unfortunately, the chances of individuals getting a stable job, or even just a new job, significantly decrease the longer an individual stays out of work. This happens not only because employers look at recent work histories to screen candidates, but also because some previously necessary work skills may no longer be in demand in the post-COVID labor market. One characteristic sets this group apart from others: it has by far the highest concentration of Minnesotans of color or of mixed race (39%). The group with the lowest concentration of workers of color, Group 1 (20%), fared the best.
The next set of graphs aggregate the groups in Table 2 into four categories instead of five. These four groups are: workers who were recalled by their employer (blue), workers who switched employer or continued working in a second job (green), and workers who were not working (not reemployed), broken down by those who continued to request benefits (yellow) and those who did not (grey).
In Figure 1 we can see clearly that workers with lower wages and those who worked seasonal or part-time prior to the pandemic were less likely to return to work during spring 2021. This implies that the highest earning workers were able to weather the crisis without displacement from their previous employer while the working poor were more likely to have suffered permanent job and income losses.
Figure 1
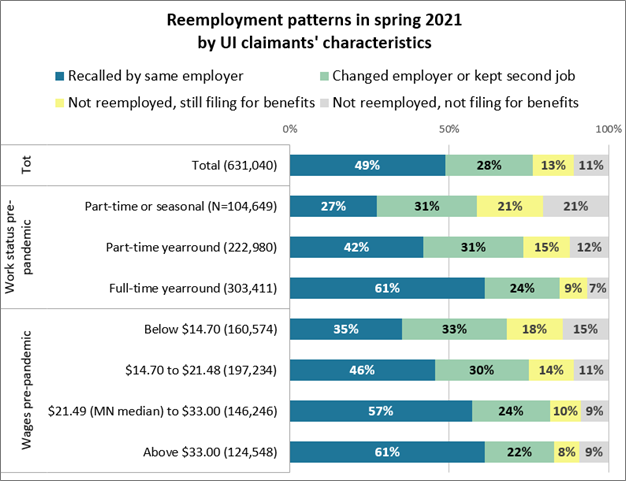
Figure 1 also shows that claimants who were employed part-time or seasonally prior to the pandemic were the least likely to return to work, with a combined share of 42%, the largest of all demographics. Specifically, 21% remained on UI and 21% left UI. This stems from low attachment to the labor market, which is highly correlated with age. Since the youngest and oldest workers were most likely to work part-time or seasonally, they were also the least likely to return to work one year after the pandemic broke out (Figure 2).
Figure 2
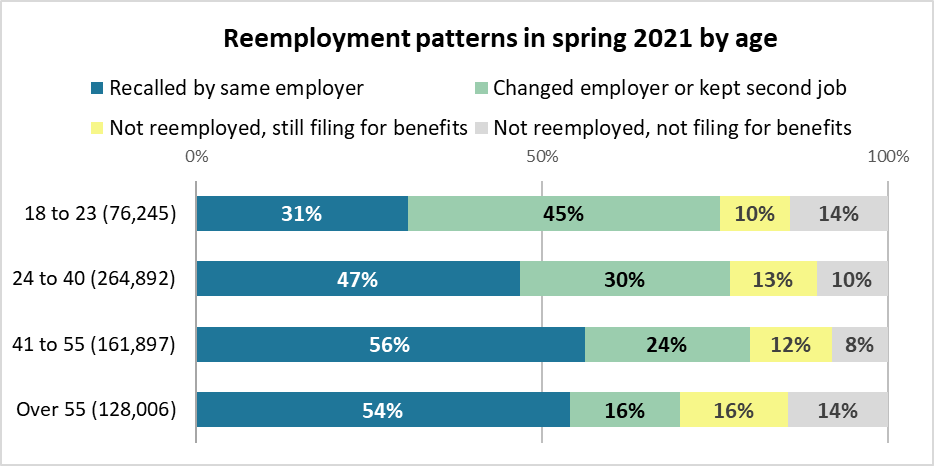
Among claimants over 55, 14% were still out of work and had stopped filing for UI. As mentioned before, we hypothesize that some retired. The other age group with lower reemployment rates is represented by the youngest claimants. They were the most likely to have changed employer (45%) probably because they held summer jobs or part-time jobs prior to the pandemic.
The other characteristic highly correlated with the likelihood of reemployment is education level (Figure 3): As education level increases so do recall rates and overall reemployment rates in a strong linear relationship. Claimants with less than a high school education5 had the highest likelihood of being out of work and collecting benefits in spring 2021 (19%) followed by claimants with high school or equivalent (16%).
Figure 3
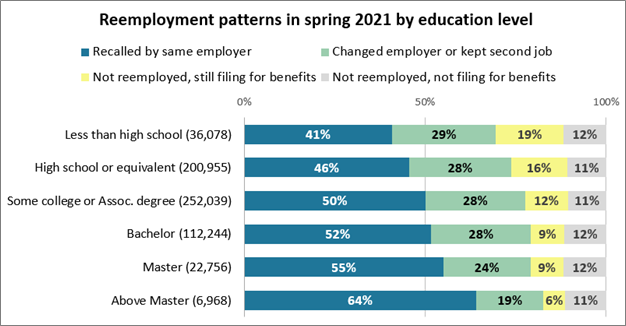
Not only were individuals without a four-year degree significantly more likely to have been laid off or furloughed due to COVID19-induced closures, but they were also more likely to experience difficulties returning to work. Less-educated workers are the most vulnerable during economic crises because they are already in precarious or part-time work arrangements. Furthermore, in the post-pandemic labor market there aren't many places to look for economically sustaining employment options at their current skill level.
Finally, Figure 4 presents the same information by race/ethnicity, revealing stark disparities. Only 30% of Black workers returned to the employer who laid them off, by far the least likely of any race or ethnic group. This indicates weak ties to employers, which is typical of the precarious or temporary work arrangements that plague Black workers in Minnesota.
This group's desire to return to work is demonstrated by the high shares, 32%, who switched employer.
Figure 4
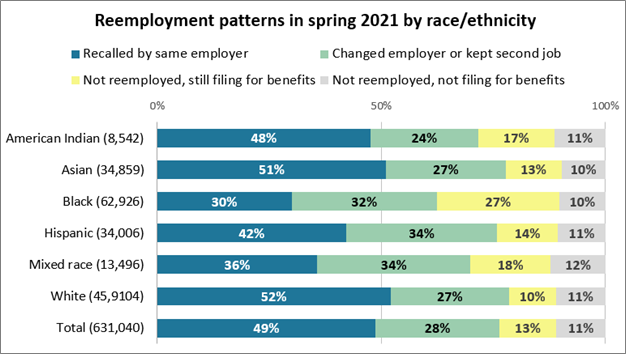
Unfortunately, however, this group was the most likely to be requesting UI benefits (27%) and not working in spring 2021. These individuals (yellow bar), comprising 27% of Black claimants, were not continuously on UI since their first layoff. One out of three returned to work in summer 2020, but then lost those jobs. Another 14% returned to work between fall 2020 and winter 2021, but then lost those jobs. The precariousness of reemployment among these workers leads to higher UI recidivism.
The share of individuals not reemployed and not filing for UI was constant across race groups, suggesting that race played no role in workers' likelihood of falling into this category.
Claimants of white race had by far the highest recall rates, 52%, and the lowest rates of UI benefits requests (10%) after June 2021. In other words, they were able to either return to previous jobs, successfully switch employers or return to second jobs. Based on this evidence, the pandemic has exacerbated pre-existing racial inequities in the labor market.
This evidence shows that the pandemic took a greater toll on workers who were already struggling with a wide range of barriers to maintaining stable employment. Besides those already discussed, another barrier associated with a higher risk of prolonged unemployment is disability status6.
Thus far we've looked at how workers' ability to return to work varies by demographic characteristics. We will now look at reemployment patterns by industry, with the aim of answering two questions: Which industries were more successful at recalling workers? And which industries had the largest shares of workers who were able to return to work, whether or not they returned to their original employer?
The first question, based on recall rates, is represented by the blue bars in Figure 5. It is an indicator of how quickly an industry was able to rebound from the COVID-19 economic shock and get their employees back. The second question, based on reemployment rates, is represented by the blue and green bars combined. It is an indicator of the ability of workers from each industry to rebound from a job loss. The two measures are related but have different policy implications. The second measure is used to rank-order the industries in Figure 5.
Figure 5
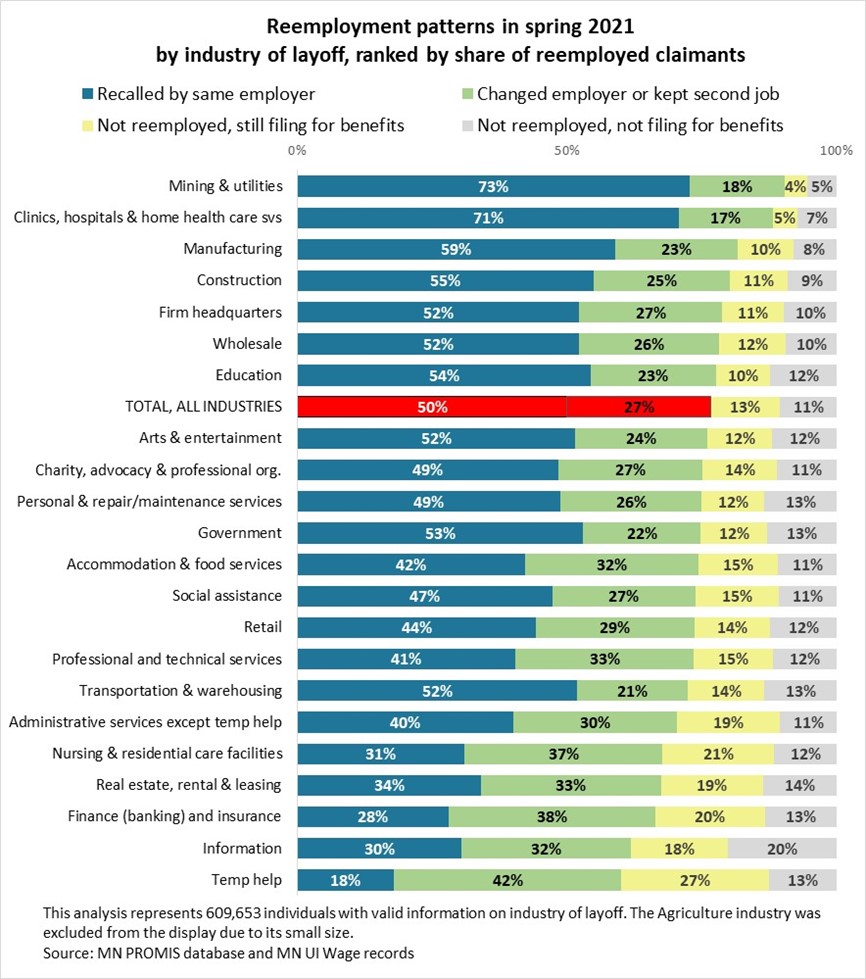
The share of reemployed workers across industries (the red bars) is 77%, as seen in Table 1. The industries displayed above the red bars rebounded quickly and their workers experienced minimal disruptions, while those under the red bars are still struggling and/or their workers may need to retrain for different careers.
The industries with the highest shares of reemployed workers are Mining & Utilities (73%+18%), Clinics, Hospitals & Home Health Care Services (71%+17%), followed by Manufacturing (59%+23%), Construction (55%+25%), Firm Headquarters (52%+27%) Wholesale (52%+25%) and Education (54%+23%). Workers laid off from these industries were the most successful at getting back to work either by returning to the original employer or by switching employers. This is not surprising considering that these industries were less impacted by the pandemic and are higher skill industries where workers are more often treated as permanent employees.
Underneath the red bar we find industries with shares of reemployed workers lower than the total. The first we encounter is Arts & Entertainment, one of the hardest hit by the pandemic. Reemployment rates of 75% are extremely good news. The second hardest hit industry, Accommodation & Food Services, is not too far down the list, which is also welcome news. The extremely large share of claimants who did not return to their original employer (32%) suggests that some switched industry. This is good news for workers, but the implications for the outlook of the industry are not yet clear. We will need to wait for summer 2021 data to become available to see a clearer picture7.
Further down the list are the in-trouble sectors. Specifically, those with the shortest blue bars experienced the largest long-term loss of workers. Nursing & Residential Care Facilities is one of them, not because it is losing jobs (this sector is actually experiencing severe labor shortages) but because it struggles with worker retention. This is evident in the large share, 37%, who switched employer. A large share, 21%, are still not employed and filing for benefits. How can there be unemployed former workers in an industry that is experiencing shortages? Notoriously undesirable work conditions in the industry and worker's concerns with safety8 contribute to this situation. Furthermore, the large share still receiving UI benefits in spring 2021 could reflect the ongoing difficulties faced by low-skilled workers, many of whom are workers of color, in finding better jobs than those lost during the pandemic.
Are claimants from industries at the bottom of Figure 5 at high risk of prolonged unemployment? The answer could be yes. Job cuts in Information, especially news media and cable services, are likely to continue because of automation. Real Estate & Rental & Leasing seems likely to suffer permanent losses as the growing use of remote work technologies curtail the need for business travel and, thus, car rental services. Likewise, former workers from Finance & Insurance (including banks) and Administrative Services might continue to experience layoffs in the future as employers take advantage of remote work to reduce building occupancy costs and customers increasingly access services online. Since there will not be a full rebound in consumer demand for these types of services, jobs in building maintenance/security and front-desk services (such as bank tellers) may not come back to pre-pandemic level.
Finally, at the bottom of the list we find Temporary Help Services, with the lowest share of recalled workers (18%) and the highest share of claimants who did not return to work (27+13=40%). This is to be expected given the short-term nature of employment in this sector. While the industry is rebounding from these losses as the economy picks up steam, workers in this industry are more vulnerable than others to permanent layoffs. Moreover, claimants of color are over-represented in this sector. Therefore, workers laid off from this sector ought to be targeted with interventions aimed at alleviating barriers to stable employment.
Another important question is what kinds of jobs were lost during the early months of the pandemic and which ones appear more at risk of not coming back. Figure 6 shows higher recall rates among Healthcare Practitioners (71%), Architecture & Engineering (64%), Installation/Maintenance & Repair (54%), Construction & Extraction (54%) and Production (52%). These occupations are predominantly employed in the industries shown in Figure 5 as having the highest recall rates: Mining & Utilities, Clinics & Hospitals, Manufacturing, and Construction.
Figure 6
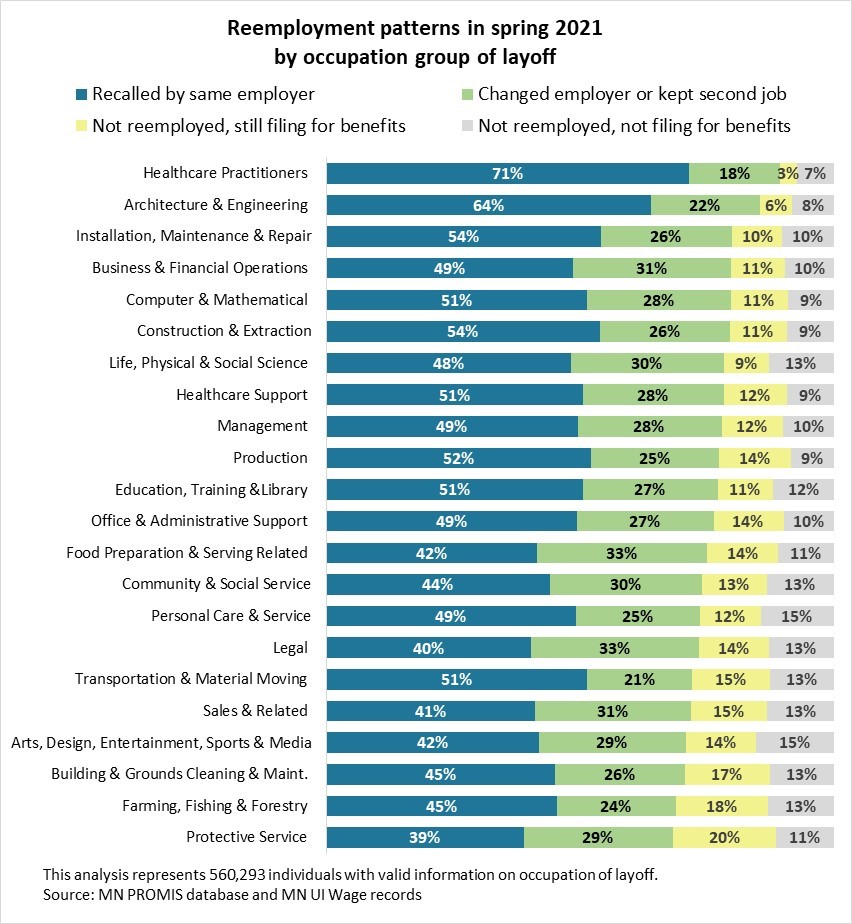
At the other end of the spectrum, the types of occupations with the highest shares of workers leaving their employer and not returning to work – and therefore more at risk of long-term unemployment – are Arts, Design, Sports & Media, Building and Grounds Cleaning & Maintenance, Farming, Fishing & Forestry, and Protective Service9, therefore with lower prospects of changing career and relatively weak ties with former employers.
Claimants from Food Preparation & Serving had almost identical outcomes as the industry most of them originated from, Accommodation & Food Services, (see Figure 5) with a 42% recall rate. The high share of claimants who changed employer or kept a second job (33%) helped maintain a reemployment rate higher than other occupational groups less severely impacted by the pandemic. This is good news because Food Preparation & Serving represents by far the biggest group of claimants, 88,210. Lower rates of reemployed workers in this group would have left many Minnesotans without income beyond the weekly UI benefit.
This study finds that, a year into the COVID-19 recession, the Minnesota labor market was strong enough to reemploy three out of four (77%) of UI claimants who were laid off from March to August of 2020. Despite this overall positive news, the study paints a picture of a two-tiered recovery, both from the point the view of impacted workers and impacted economic activities.
In terms of workers, some categories are being left behind, especially those who are Black, over age 55, and/or have lower levels of educational attainment. The same challenges that hindered certain workers from accessing stable employment at living wages before the pandemic – including racial disparities, education achievement gaps, and other barriers such as older age – continue to prevent them from reentering the labor market.
In terms of economic activities, some sectors – such as Nursing & Residential Care Facilities – are still struggling to recall and/or retain workers and may lose competitiveness as a consequence. Others, by contrast, could offer solid reemployment opportunities – with the help of workforce training or other incentives – to Minnesotans who suffered the most from job displacements.
1This is counting only those workers applying from UI covered jobs. It does not include self-employed and gig workers who cannot be tracked in UI wage records.
2Other criteria for inclusion in this analysis is having filed a continuing (certified) claim, being age 18-86, being a Minnesota resident, and being employed in any of the three quarters preceding the start of the pandemic. These criteria are designed to avoid capturing individuals who filed fraudulent claims or were self-employed (PUA recipients) and who, by definition, do not have a reliable measure of reemployment in UI wage records. Some self-employed individuals could nevertheless be captured in these figures if they had some form of covered employment in the base period.
3Transitioning to a new job involves a loss in hours worked (and thus total quarterly earnings) unless the start of the new job lines up perfectly with the end of the old job.
427% of claimants in Group 5 were over age 55 at the time of filing (in 2020).
5Since our dataset is restricted to claimants aged 18 and over, most of the 36,078 claimants with less than high school probably completed high school by June 2020.
6Source: Profile of Risk for Prolonged Unemployment dashboard.
7Hiring activity in the spring is low in this industry due to seasonality. Some more workers might have returned to their employers in summer 2021.
8Nursing homes and other community establishments in this industry are extremely vulnerable to COVID outbreaks.
9While there are some high-skilled occupations in protective services, such as police and correctional officers, these were a small minority among claimants. Out of 3,482 claimants in Protective Services, 2,521 were Security Guards, a low-skilled occupation with typically temporary employment. Gaming Surveillance Officers came second with 205 claimants.