by Cameron Macht
June 2015
As Minnesota's economy has recovered, hiring activity has picked up across the state. In the second quarter of 2015 total non-farm employment was up 1.7 percent over the past year and had expanded nearly 8 percent since 2010. According to estimates from DEED's Current Employment Statistics (CES) program, the state regained more than 205,000 jobs from April of 2010 to April of 2015, including a huge boost of more than 45,000 jobs in the past year.
By sector, the most impressive job increases occurred in Construction, Professional and Business Services, Leisure and Hospitality, Educational and Health Services, and Manufacturing. The state also saw growth in Other Services, Financial Activities, and Trade, Transportation, and Utilities. In contrast, only the Information, Government, and Mining and Logging sectors suffered year-over-year job declines. In response, Minnesota's labor force continued growing, surpassing 3 million available workers in early 2015. Of those workers just over 2.9 million were employed and less than 115,000 were unemployed and actively seeking work in April, driving the state's unemployment rate below 4.0 percent.
Those were significant improvements compared to April of 2010 when the state had just over 2.9 million total labor force participants, 2.7 million employed workers, and almost 220,000 unemployed workers. Since then, the workforce expanded by more than 80,000 new workers, a steady 2.7 percent increase, while the number of unemployed workers was essentially cut in half (see Table 1).
| Table 1. Minnesota Labor Force Statistics, 2010-2015 | ||||||
|---|---|---|---|---|---|---|
| April 2010 | April 2011 | April 2012 | April 2013 | April 2014 | April 2015 | |
| Available Labor Force | 2,934,149 | 2,934,641 | 2,934,695 | 2,956,051 | 2,962,016 | 3,014,775 |
| Employed Workers | 2,715,352 | 2,740,904 | 2,776,249 | 2,806,012 | 2,835,415 | 2,900,979 |
| Unemployed Workers | 218,797 | 193,738 | 158,446 | 150,039 | 126,601 | 113,796 |
| Unemployment Rate | 7.5% | 6.6% | 5.4% | 5.1% | 4.3% | 3.8% |
| Source: DEED Local Area Unemployment Statistics (LAUS) program | ||||||
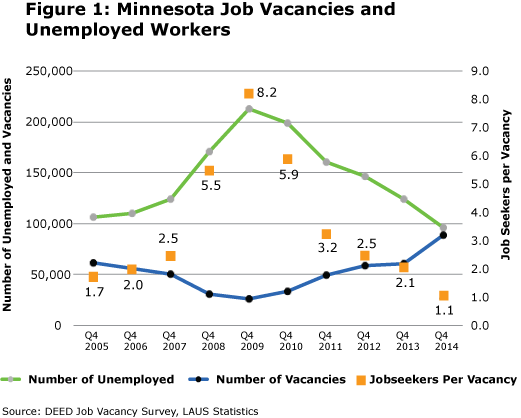
The increase in jobs coupled with the decline in unemployed job seekers has led to very tight labor market conditions across the state, which will only intensify as baby boomers retire and job growth continues. During the fourth quarter of 2014, employers in Minnesota reported a total of 88,900 vacancies which was the second highest number ever recorded.
Job vacancies increased 47 percent over the prior year and 163 percent since the fourth quarter of 2010, when the state's economy began working its way out of the Great Recession. Statewide, there are now just 1.1 unemployed job seekers for each job vacancy, which is also the second lowest number on record.
The current 1.1-to-1 ratio was down from 2.1 job seekers per job opening the year prior and way down from about six unemployed people for each vacancy in the fourth quarter of 2010. After having their pick of qualified applicants just five years ago, some employers are now scrambling to find applicants at all (see Figure 1).
The largest number of openings was found in the Health Care and Social Assistance industry, followed by Accommodation and Food Services, Retail Trade, and Manufacturing. Combined, those four industries now account for almost 60 percent of total job vacancies in the state and provided two-thirds of the increase in vacancies over the past year.
About 40 percent of the job vacancies were for part-time employment, defined as fewer than 35 hours per week, which has been surprisingly consistent each of the past five years. Likewise, about 40 percent of the jobs required some level of postsecondary education or training beyond a high school diploma, which has also been very consistent over time.
The median or 50th percentile wage offer for all job vacancies was $13.29 per hour in the fourth quarter of 2014, which was up 2.2 percent from the prior year. However, wage offers were highly correlated with experience and education requirements: on average, the more education and/or experience required, the higher the wage offer.
Job vacancy data prove that the competition for applicants is picking up. Beyond just posting new job openings, however, in order actually to add jobs, employers actually have to hire new workers. To examine the amount of hiring activity in the state, this article uses New Hires, Stable data from DEED's Quarterly Workforce Indicators (QWI) program.
Unlike statistics tabulated from firm or person-level data, the QWI source data are unique job-level data that link workers to their employers using the Census Bureau's Longitudinal Employer-Household Dynamics program, which covers over 95 percent of U.S. private sector jobs. Much of these data are collected via a unique federal-state data sharing collaboration, the Local Employment Dynamics (LED) partnership.
"Because of this link, labor market data in the QWI are available by worker age, sex, educational attainment, and race/ethnicity. This allows for analysis by demographics of a particular local labor market or industry... Links between workers and firms also allow the QWI to identify worker flows - hires, separations, and turnover - as well as net employment growth. As most hiring activity is the consequence of worker turnover rather than employment growth, a focus on employment growth alone may misrepresent employment opportunity in the local labor market."1.
New Hires, Stable are defined as the "estimated number of workers who started a job that they had not held within the past year, and the job turned into a job that lasted at least a full quarter with a given employer. Jobs are counted as a stable hire in the first quarter of full quarter employment, rather than the first quarter of employment."2.
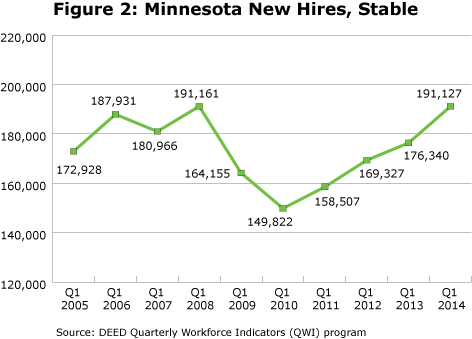
Comparing the number of stable new hires in the first quarter of the past five years shows the extent of the recovery in hiring activity across the state. New hires fell from just over 191,000 in the first quarter of 2008, as the Great Recession was setting in, to just under 150,000 new hires in the first quarter of 2010 at the nadir of the recession. Hiring activity has steadily climbed back to just over 191,000 new hires in the first quarter of 2014 (see Figure 2).
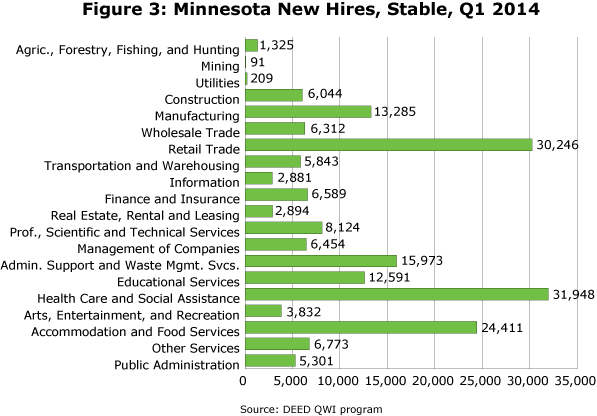
Health Care and Social Assistance had the largest amount of stable new hires in the most recent quarter, with just under 32,000 new hires. But it was followed closely by Retail Trade, which also hired over 30,000 workers. Accommodation and Food Services also recorded almost 24,500 stable new hires in the first quarter of 2014. Combined, those three industries accounted for almost half of the total new hires in the state.
The next largest number of stable new hires were logged in Administrative Support and Waste Management Services, which includes staffing agencies - suggesting that even those temporary job opportunities are becoming more permanent. That industry had nearly 16,000 stable new hires in the first quarter of 2014, many of whom were placed in the Manufacturing industry, which had 13,285 stable new hires of its own (see Figure 3).
As shown in Figure 3, the Educational Services industry reported about 12,600 stable new hires, of which 53.7 percent of those workers had some college or an Associate's, Bachelor's, or advanced degree. That was one of the highest rates of hiring activity for workers with college experience, behind just Finance and Insurance and Professional, Scientific, and Technical Services (see Figure 4).
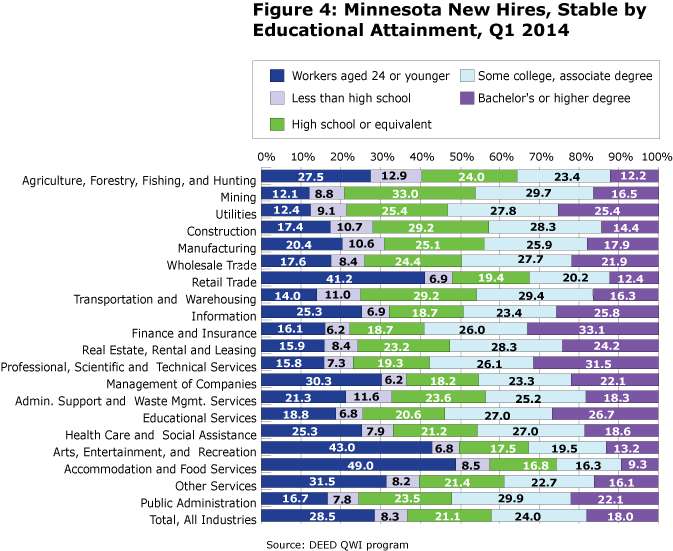
About 42 percent of stable new hires in the first quarter of 2014 had some college experience, including 18 percent that had a Bachelor's degree or higher. Workers with higher education made up a larger portion (45.4%) of new hires back in 2010, although they often displaced workers with a high school diploma or less and younger workers.
The percentage of stable new hires who were 24 years or younger increased in the past five years, now accounting for 28.5 percent of total new hires. However, certain industries like Accommodation and Food Services (49.0%), Arts, Entertainment, and Recreation (43.0%), and Retail Trade (41.2%) all relied much more heavily on these younger workers.
The number and percentage of stable new hires with a high school diploma or less improved even faster during the recovery, comprising 29.5 percent of new hires overall, compared to 27.1 percent of hires in 2010. Mining (41.8%), Transportation and Warehousing (40.3%), Construction (39.9%), Agriculture (36.9%), Manufacturing (35.8%), and Utilities (34.4%) all did the most new hiring of high school graduates or less.
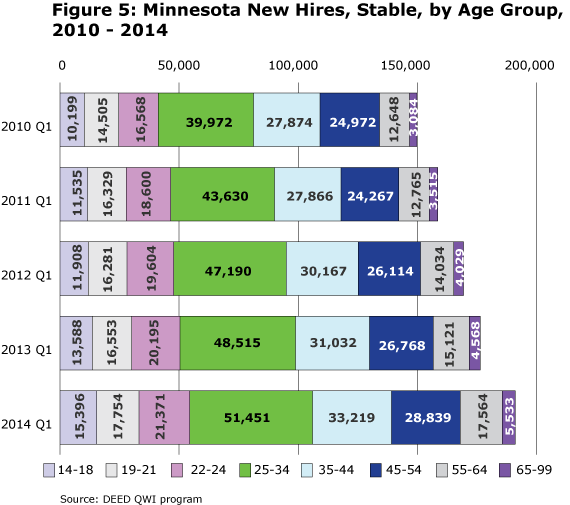
The biggest increase in new hires occurred in the youngest age groups, which got hit hardest during the recession. Teenage labor force participation rates have been dropping over time, but as employers have found it more difficult to find new available workers, teens are pouring back into the labor market and are finding long-lasting employment. The state saw an increase of nearly 5,200 more stable new hires in the 14-18 year old age group from 2010 to 2014, a 51.0 percent increase, which was about twice as fast as total hiring activity picked up.
On the other end of the age spectrum, the fastest increase in stable new hire activity between 2010 and 2014 actually occurred in the oldest age group - the number of stable new hires jumped 79.4 percent for workers aged 65 years and over, nearly three times as fast as total hiring increased.
The largest hiring expansion occurred for workers in their prime working years, from 25 to 54 years of age. This accounted for 60 percent of total stable new hire activity and a net gain of more than 20,000 new hires from the first quarter of 2010 to the first quarter of 2014 (see Figure 5).
In recent years industries like Accommodation and Food Services, Retail Trade, and Arts, Entertainment, and Recreation have increasingly relied on younger or less educated workers, while other industries such as Finance and Insurance, Professional and Technical Services, and Educational Services continue to hire workers with higher educational attainment. As baby boomers continue retiring and employers keep adding new jobs, Minnesota's labor market will continue to tighten. Employers in different industries will need to have different strategies to bring in qualified workers to meet their demands.