
by Alessia Leibert
March 2023
Among Minnesota workers laid off during the initial months of the pandemic, who has not reentered Minnesota's workforce? Who reentered and then switched industry? And who suffered the greatest loss of wages? This article seeks to answer those questions and others by examining spring 2022 employment status of Minnesotans eligible for Unemployment Insurance (UI) who filed for benefits in the initial months of the pandemic. It shows that more than three-quarters of those laid off during that time frame were working in Minnesota in spring 2022. But it also shows an inequitable recovery with workers who are Black, over age 55, or who have low educational attainment being the most likely to have left Minnesota's workforce despite the strong labor market.
From March to August 2020, 627,267 Minnesotans (20% of the workforce) eligible for UI filed for benefits1. Figure 1 summarizes the changes in their reemployment status in three-time snapshots from second quarter 2020 (the quarter of layoff) through second quarter 2022 (the most recent period of data available). We distinguish between five categories:
This provides detail on the type of reemployment that prevailed, and how this composition varied over time.
Figure 1
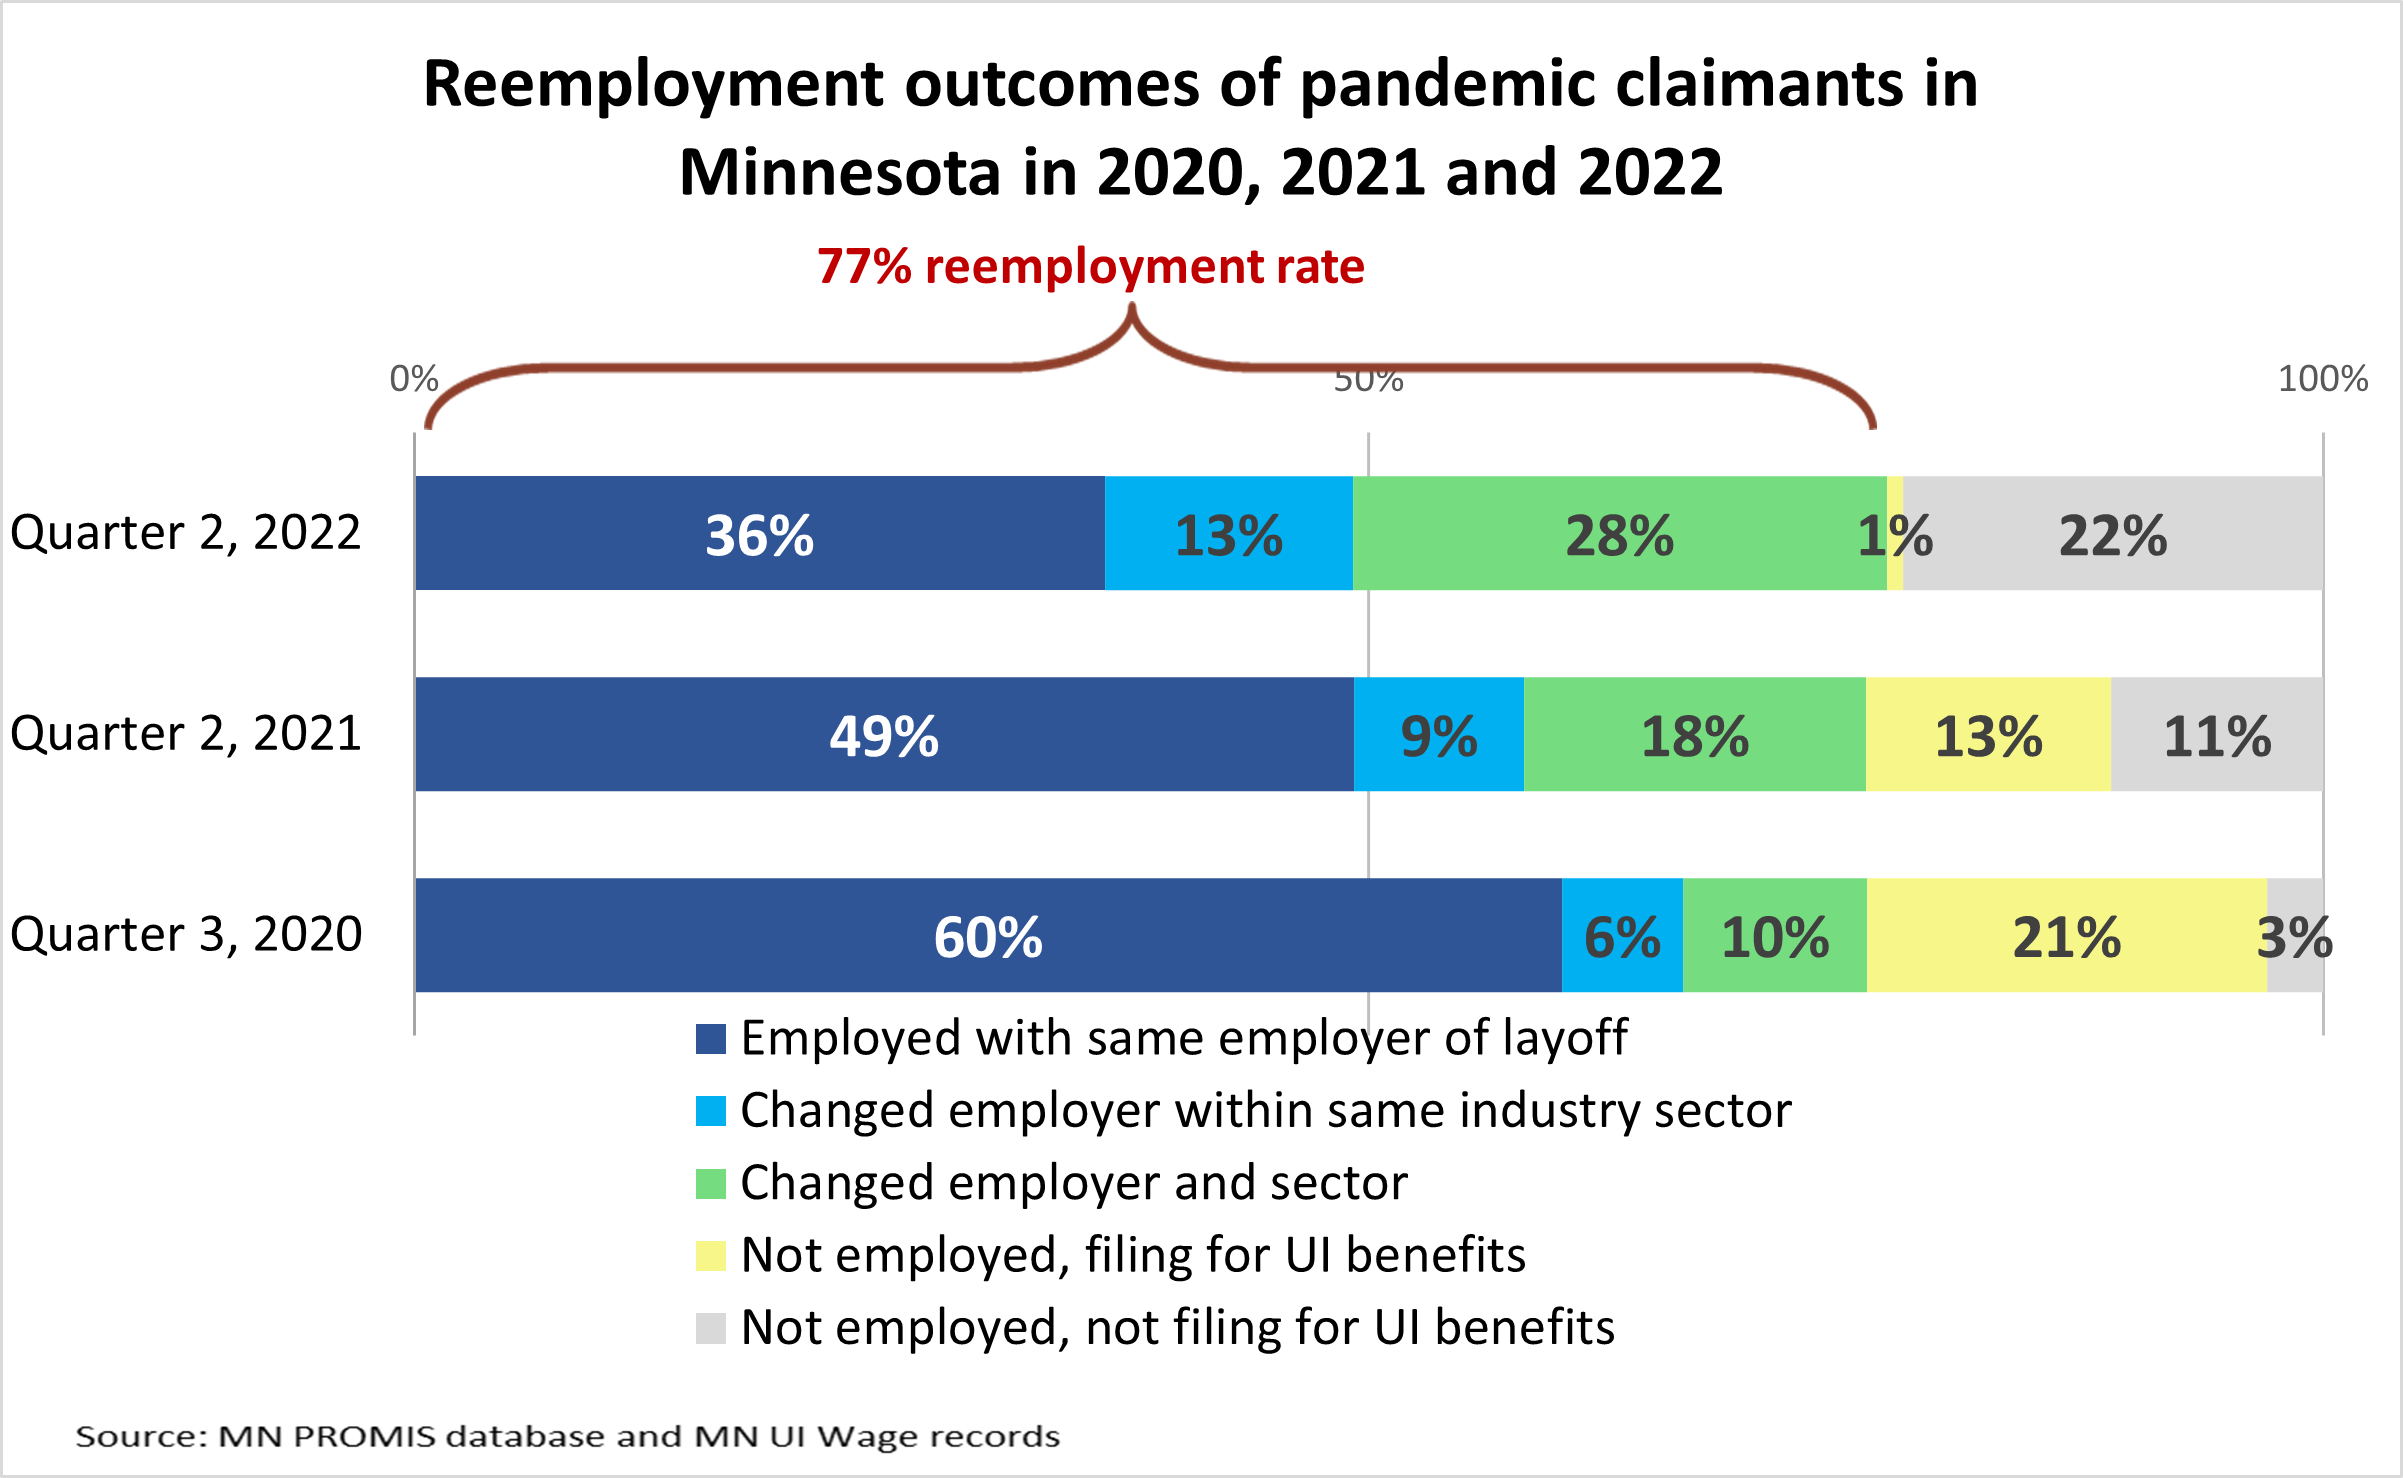
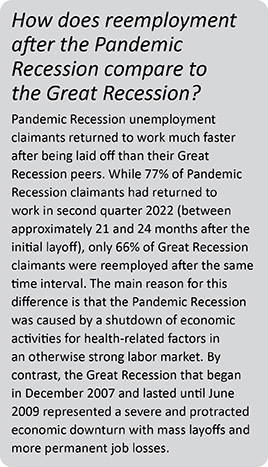 Unlike typical economic downturns, with large shares of permanently separated workers facing long periods of job search, the Pandemic Recession was characterized by temporary separations, with most claimants (60%) being quickly recalled by their employer in third quarter (summer) of 2020. When the short recession was followed by a hiring boom, workers became more optimistic about finding a better job, and voluntary quits became more common. By second quarter 2022, the share of claimants still working with the same employer had dropped to 36%. Most of those who changed employers - 28% - took jobs in a different industry from their layoff.
Little can be known about the reasons 22% left covered employment. They may have retired, died, left the state for work or school, become self-employed, or temporarily dropped out of the workforce for various reasons including seasonal employment, caregiver duties, or low-paid work.
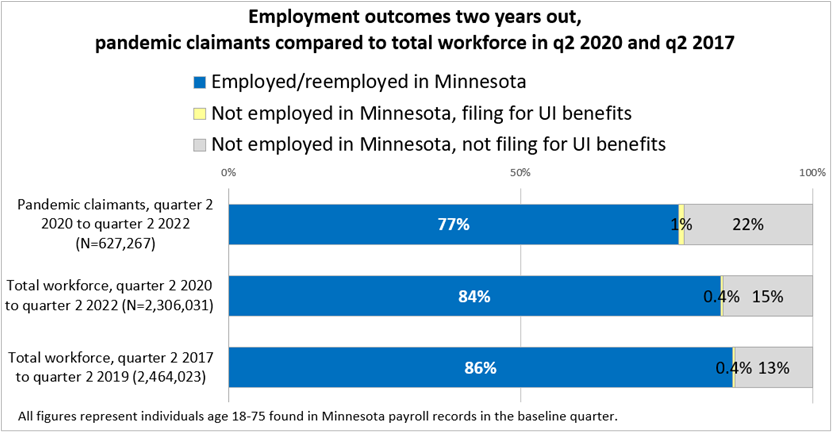
Figure 2 shows that 77% of pandemic claimants were employed in Minnesota two years after being laid off. How far from the norm is this result? To answer this question, we compare the results from second quarter 2020 to those from two alternative cohorts: the total workforce in second quarter 2020 (COVID cohort) and the total workforce in second quarter 2017 (pre-COVID cohort). Figure 2 displays these outcomes as horizontal bars: blue for the share who were employed, yellow for the share who were not employed and requesting UI benefits, and grey for the share who were neither in Minnesota payroll employment nor requesting benefits.
Figure 2
The key takeaways from this analysis are:
The remainder of the article will examine outcomes for second quarter 2022 by demographic and job characteristics to identify adversely affected categories of workers and economic sectors. The small group (less than 1%) of claimants filing for UI in the current period and visualized through the yellow bars will be excluded from the analysis for the sake of simplicity.
Few factors influence the likelihood of reemployment more than workers' age. Figure 3 shows how the reemployment rate, given by the sum of the dark blue, light blue and green bars, is small at a young age and grows until after age 55, when it suddenly decreases.
Workers over 55 were the most likely to have left Minnesota's workforce. Within the 56 to 65 age category, 28% were not found in Minnesota payroll records. This share was even higher (44%) in the 66 to 75 age category, suggesting that many retired, became ill, or died.
Figure 3
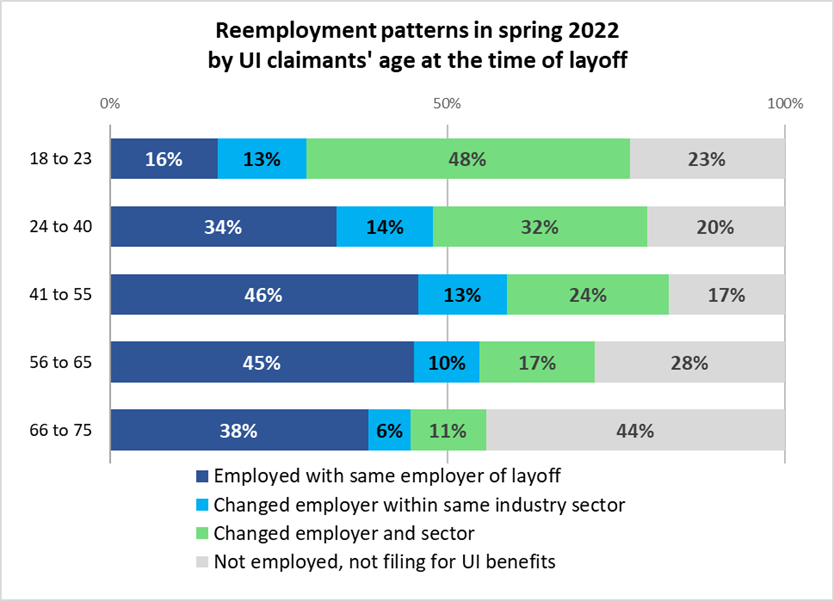
Workers younger than 24 had the second largest share who disappeared from Minnesota's payroll records (23%), but for reasons likely different from those prevailing among older workers. Rather than retirements or death, younger claimants might have dropped out of covered employment because they left the state for school or work. Larger grey bars do not mean lower labor force participation, but rather a higher propensity for outmigration2 in this group. Furthermore, those who returned to work were the least likely to be still with the same employer who laid them off (16%) and the most likely to have switched industry sector (48%).
Another characteristic associated with the likelihood of returning to work is race (Figure 4). Black workers were the most likely to be still out of work, with grey bars at 28% compared to 20% among Asian workers. Black workers were also least likely to return to the employer who laid them off, only 20% versus 39% among white workers. While this result is partially driven by the younger age of Black claimants (35 years on average versus 41 years among whites), it also reflects short employer tenure and precarious work arrangements.
Figure 4
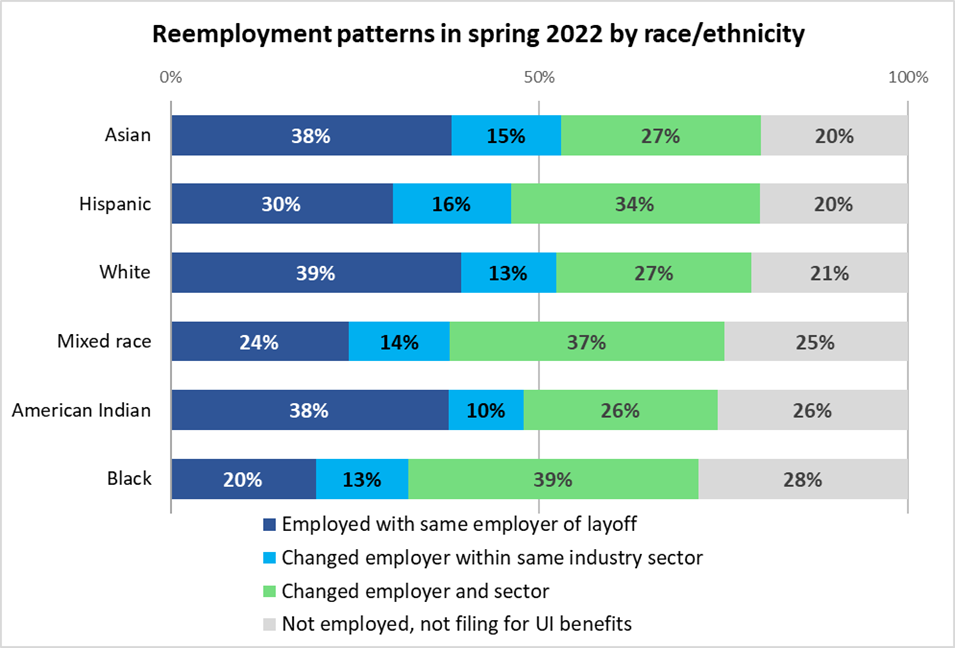
The fact that Asian and Hispanic workers, two groups with high concentrations of recent immigrants, lead white workers in reemployment demonstrates their prominent role in the state's economy. The aging of the white working-age population is offset by the younger profile and high propensity to work of both the non-white and immigrant populations.
Education level is another significant risk factor in the Pandemic Recession and recovery period. The less education, the harder it is to get back to work (Figure 5). Claimants with a high school education or less were the most likely to have permanently lost or left their job (dark blue bars at 34%) and to not have returned to Minnesota's workforce (grey bars at 23%).
Figure 5
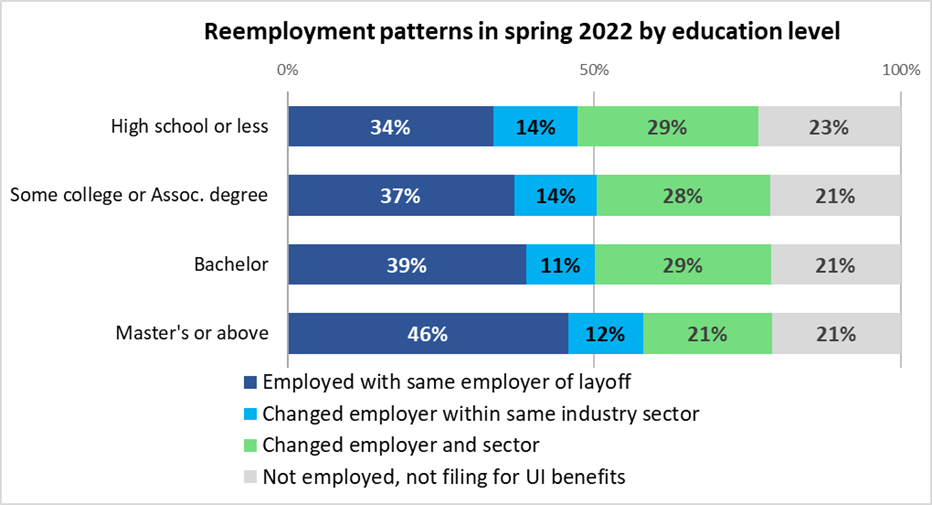
The share of workers who returned to and stayed with their pre-pandemic employer was highest among master's degree completers (46%), probably because employers pay them well or invest in non-monetary retention strategies such as flexible hours and remote work options to keep job satisfaction high.
Figure 6 presents outcomes by gender. On the surface, females had a slight advantage in reemployment compared to males. However, this result masks the fact that females had more postsecondary education overall than males. When we intersect gender with education the female advantage in reemployment disappears. Furthermore, we find that women with no education beyond high school were less likely than men to be still working with the same employer who laid them off (32% versus 35%) and far more likely to have taken jobs in a different industry (32% versus 27%).
Figure 6
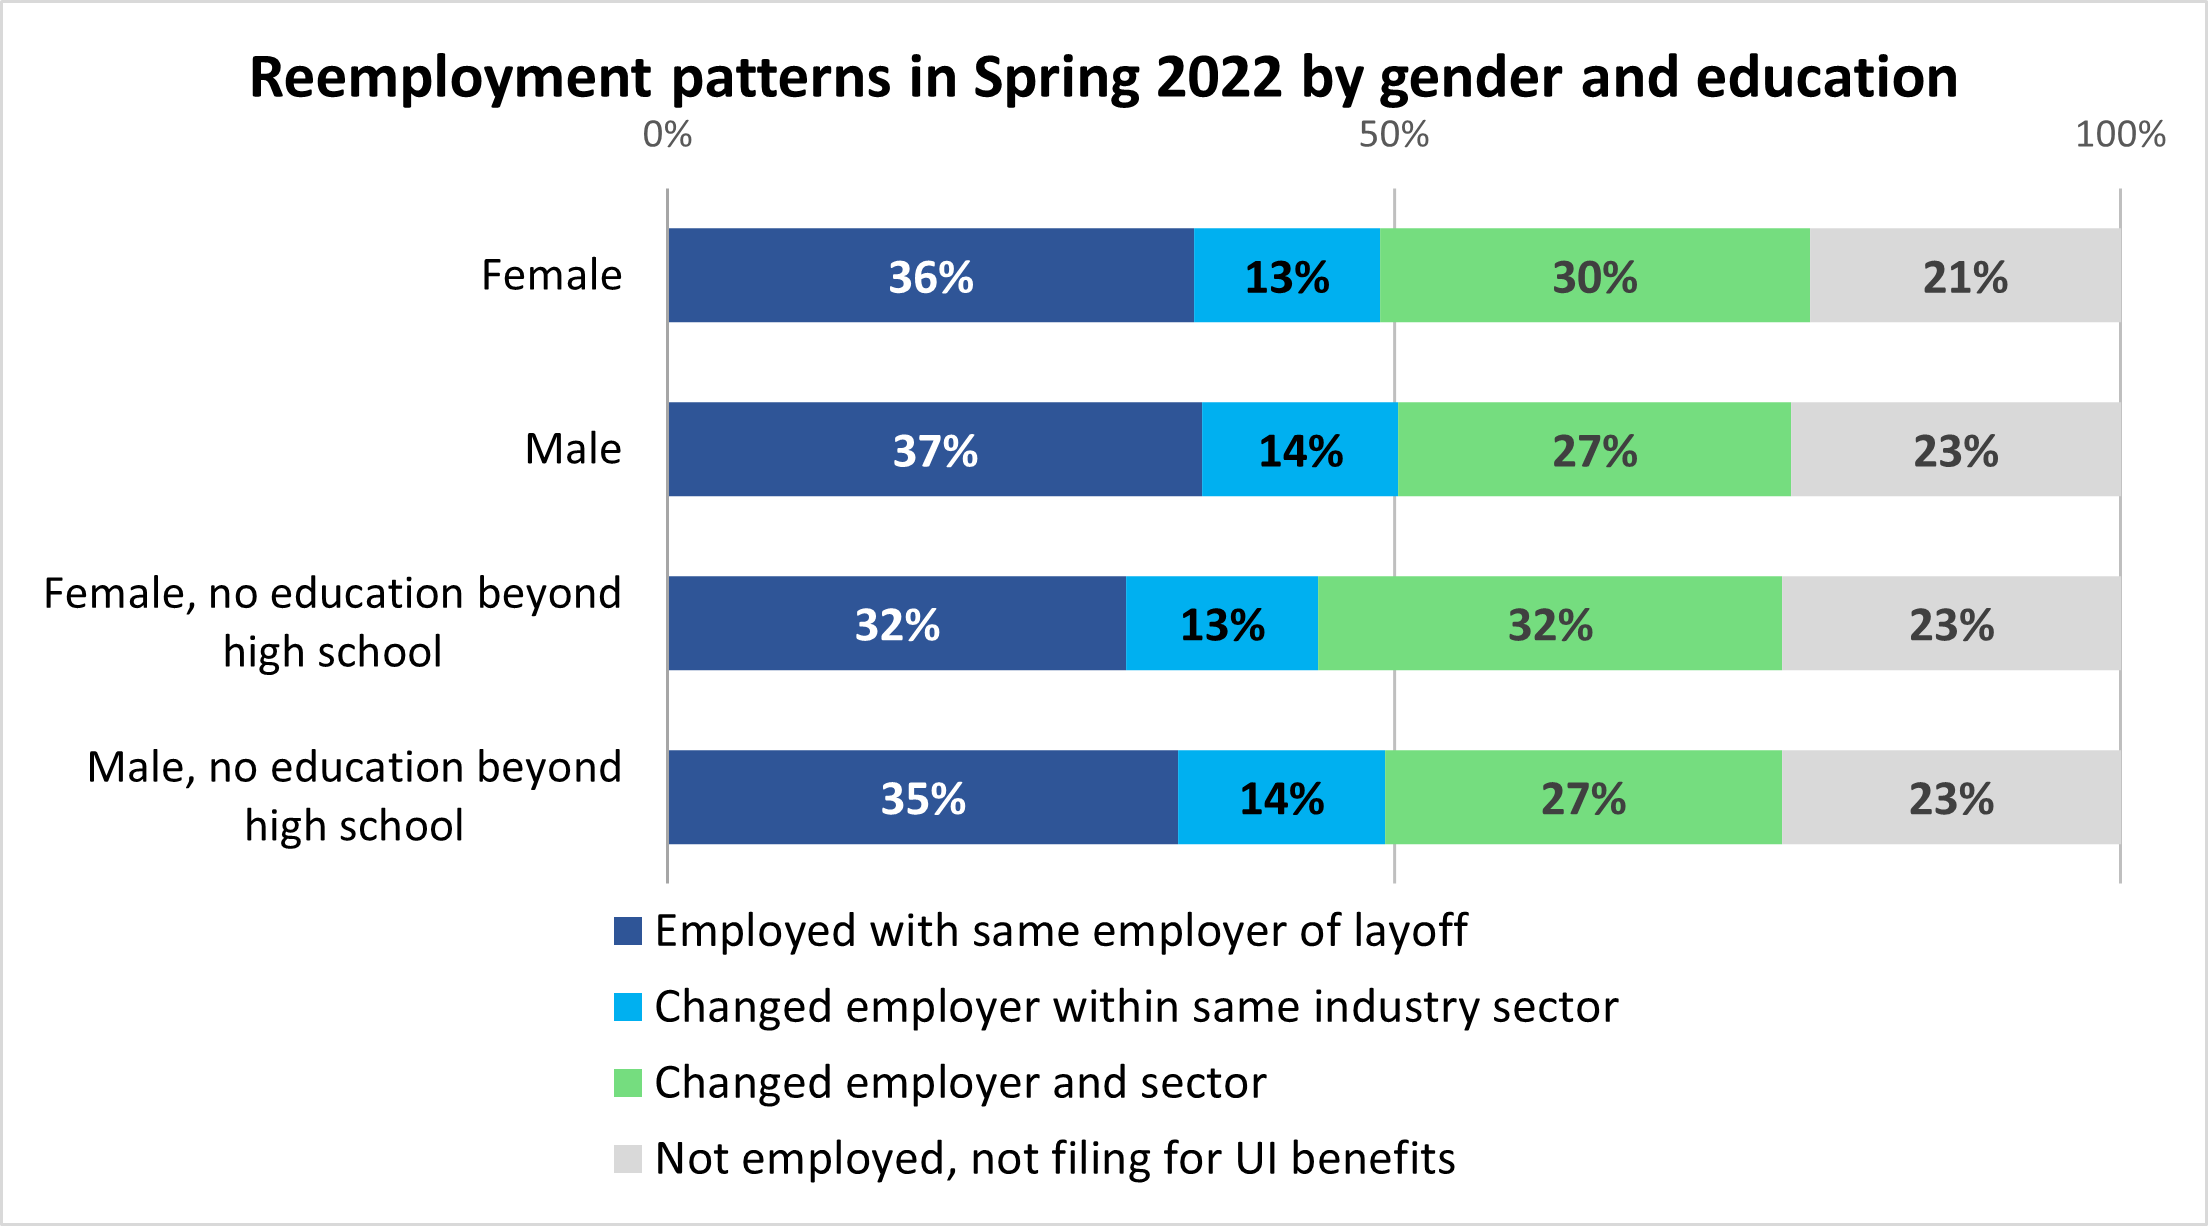
Why were women, especially those with low education, less likely than their male peers to hold on to their pre-pandemic jobs? The result might be driven by the higher prevalence of voluntary quits among women due to COVID-related constraints (school closures or lack of access to child care) or undesirable and unsafe work conditions3. This suggests that employers might find it increasingly challenging to keep female employees in the future unless they invest more in retention.
One of the key factors influencing the likelihood of returning to work is the type of job held at the onset of the pandemic, which can be measured by the industry of layoff. Figure 7 displays reemployment rates by industry comparing them to the average (the red bars) of 78%. The industries displayed above the red bars are leading in reemployment, mostly due to high retention of formerly laid-off workers: Hospitals & Clinics (dark blue bars at 57%), followed by Manufacturing (47%), Construction (45%), Firm Headquarters (41%), Wholesale (41%) and Education (39%). This is not surprising considering that these workers were recalled very early because they perform activities that were largely exempt from shutdowns during the pandemic or could be done at home (Headquarters and Education).
Figure 7
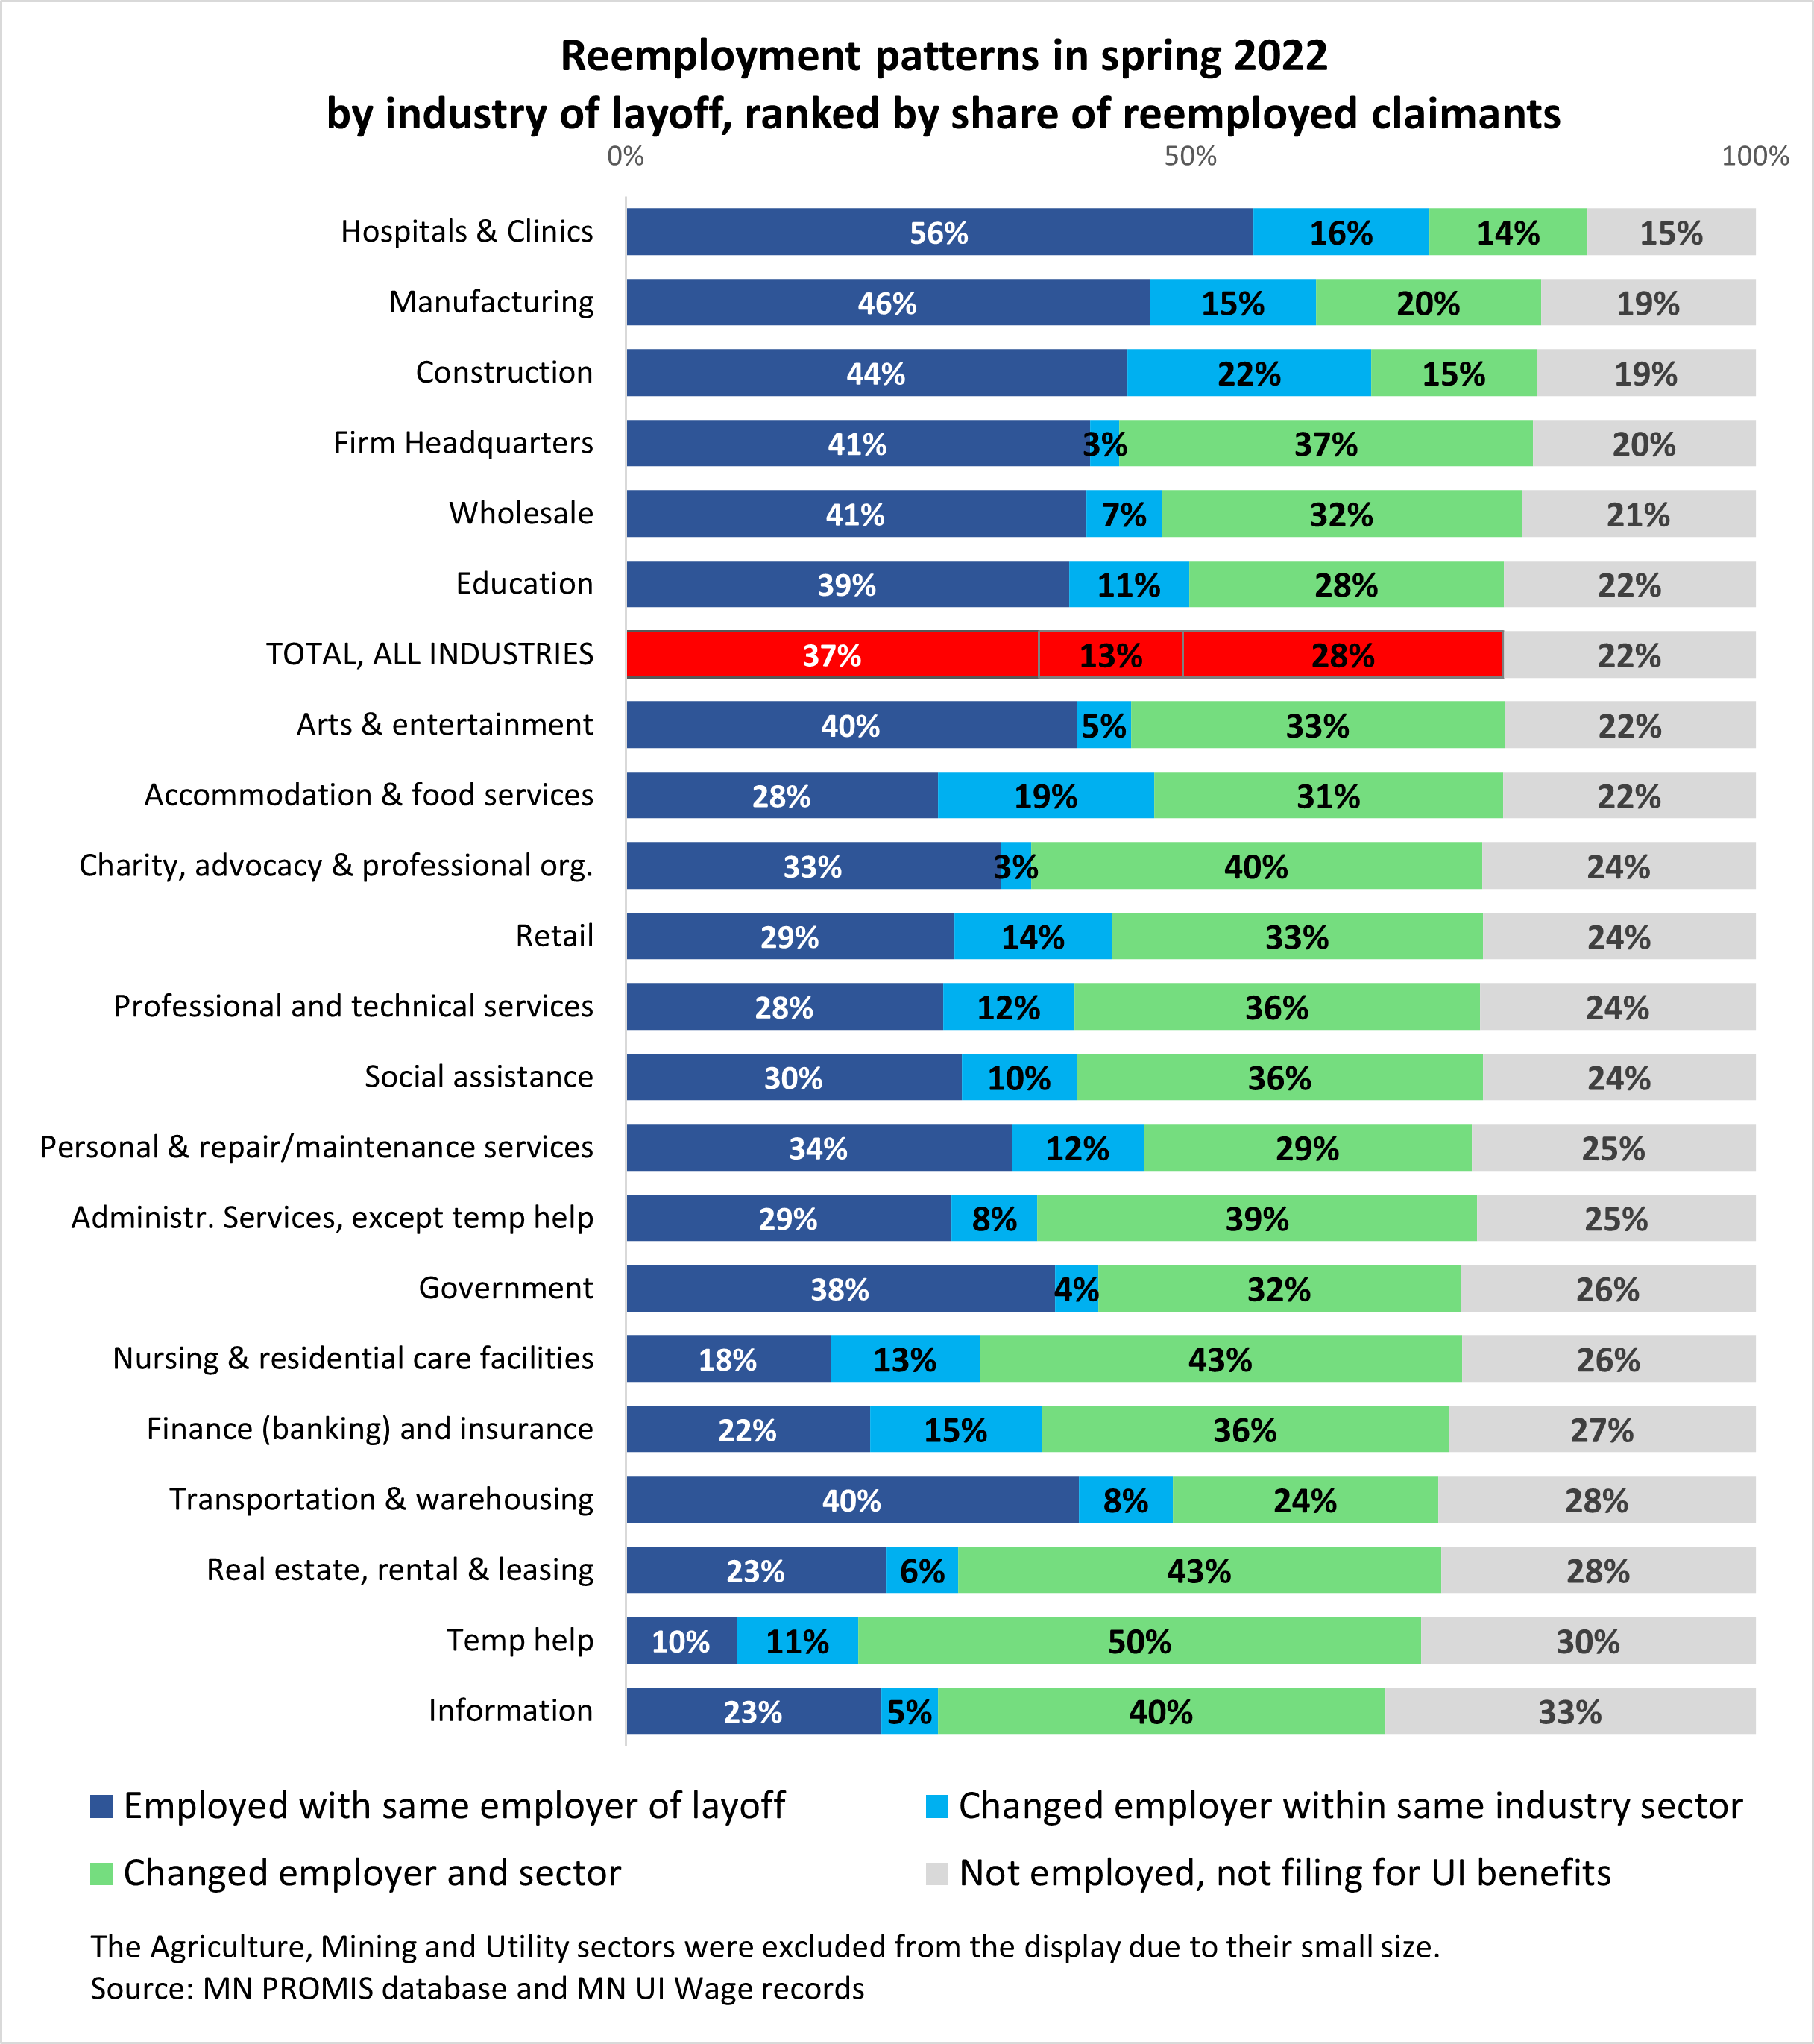
In contrast, claimants with a work history in the industries at the bottom of the list – those with the lowest reemployment shares - might have been unable to return not only to their original jobs, but to any job. Some layoffs in these industries, such as Finance & Insurance, Warehousing, Rental & Leasing, Temp Help, and Information were likely permanent due to job cuts or short work contracts. Furthermore, the fact that these workers were predominantly in low-skilled jobs that employers have been replacing with automation or eliminating as a result of reduced building occupancy (tellers, real estate agents, packaging operators, material movers, janitors and cleaners, customer service representatives, office and rental clerks, receptionists) likely hindered their return to work. Workers from these sectors and occupations at high risk of automation may need to retrain for different careers.
The poor reemployment outlook of claimants in the Information sector, with grey bars at 33%, deserves further explanation. This result is caused not only by permanent job losses in the news business, but also by the fact that some of these workers (journalists, writers, photographers, graphic designers, public relations specialists4) might have turned to gig and free-lance work that is not captured in covered employment.
Some industry sectors struggled more than others to get their employees back. To identify them, Figure 8 presents the same data from Figure 6 rank-ordered based on the total shares of claimants who remained in the same industry (purple bars), whether or not they returned to the same employer. The large variation in shares, ranging from 71% to 21%, is evidence of the uneven impact of the Pandemic Recession on different economic activities.
The sectors topping the list – Hospitals & Clinics, Construction, and Manufacturing – were the most successful at retaining former employees. Workers in these sectors are more likely to be permanent or have union-backed work contracts than workers in other industries, suggesting that higher wages and job security might also have encouraged more individuals to remain in the sector. In contrast, the sectors at the bottom experienced the largest hemorrhage of workers, either because of permanent job losses or because they struggle to compete with other sectors in the fierce post-pandemic race for talent.
Figure 8
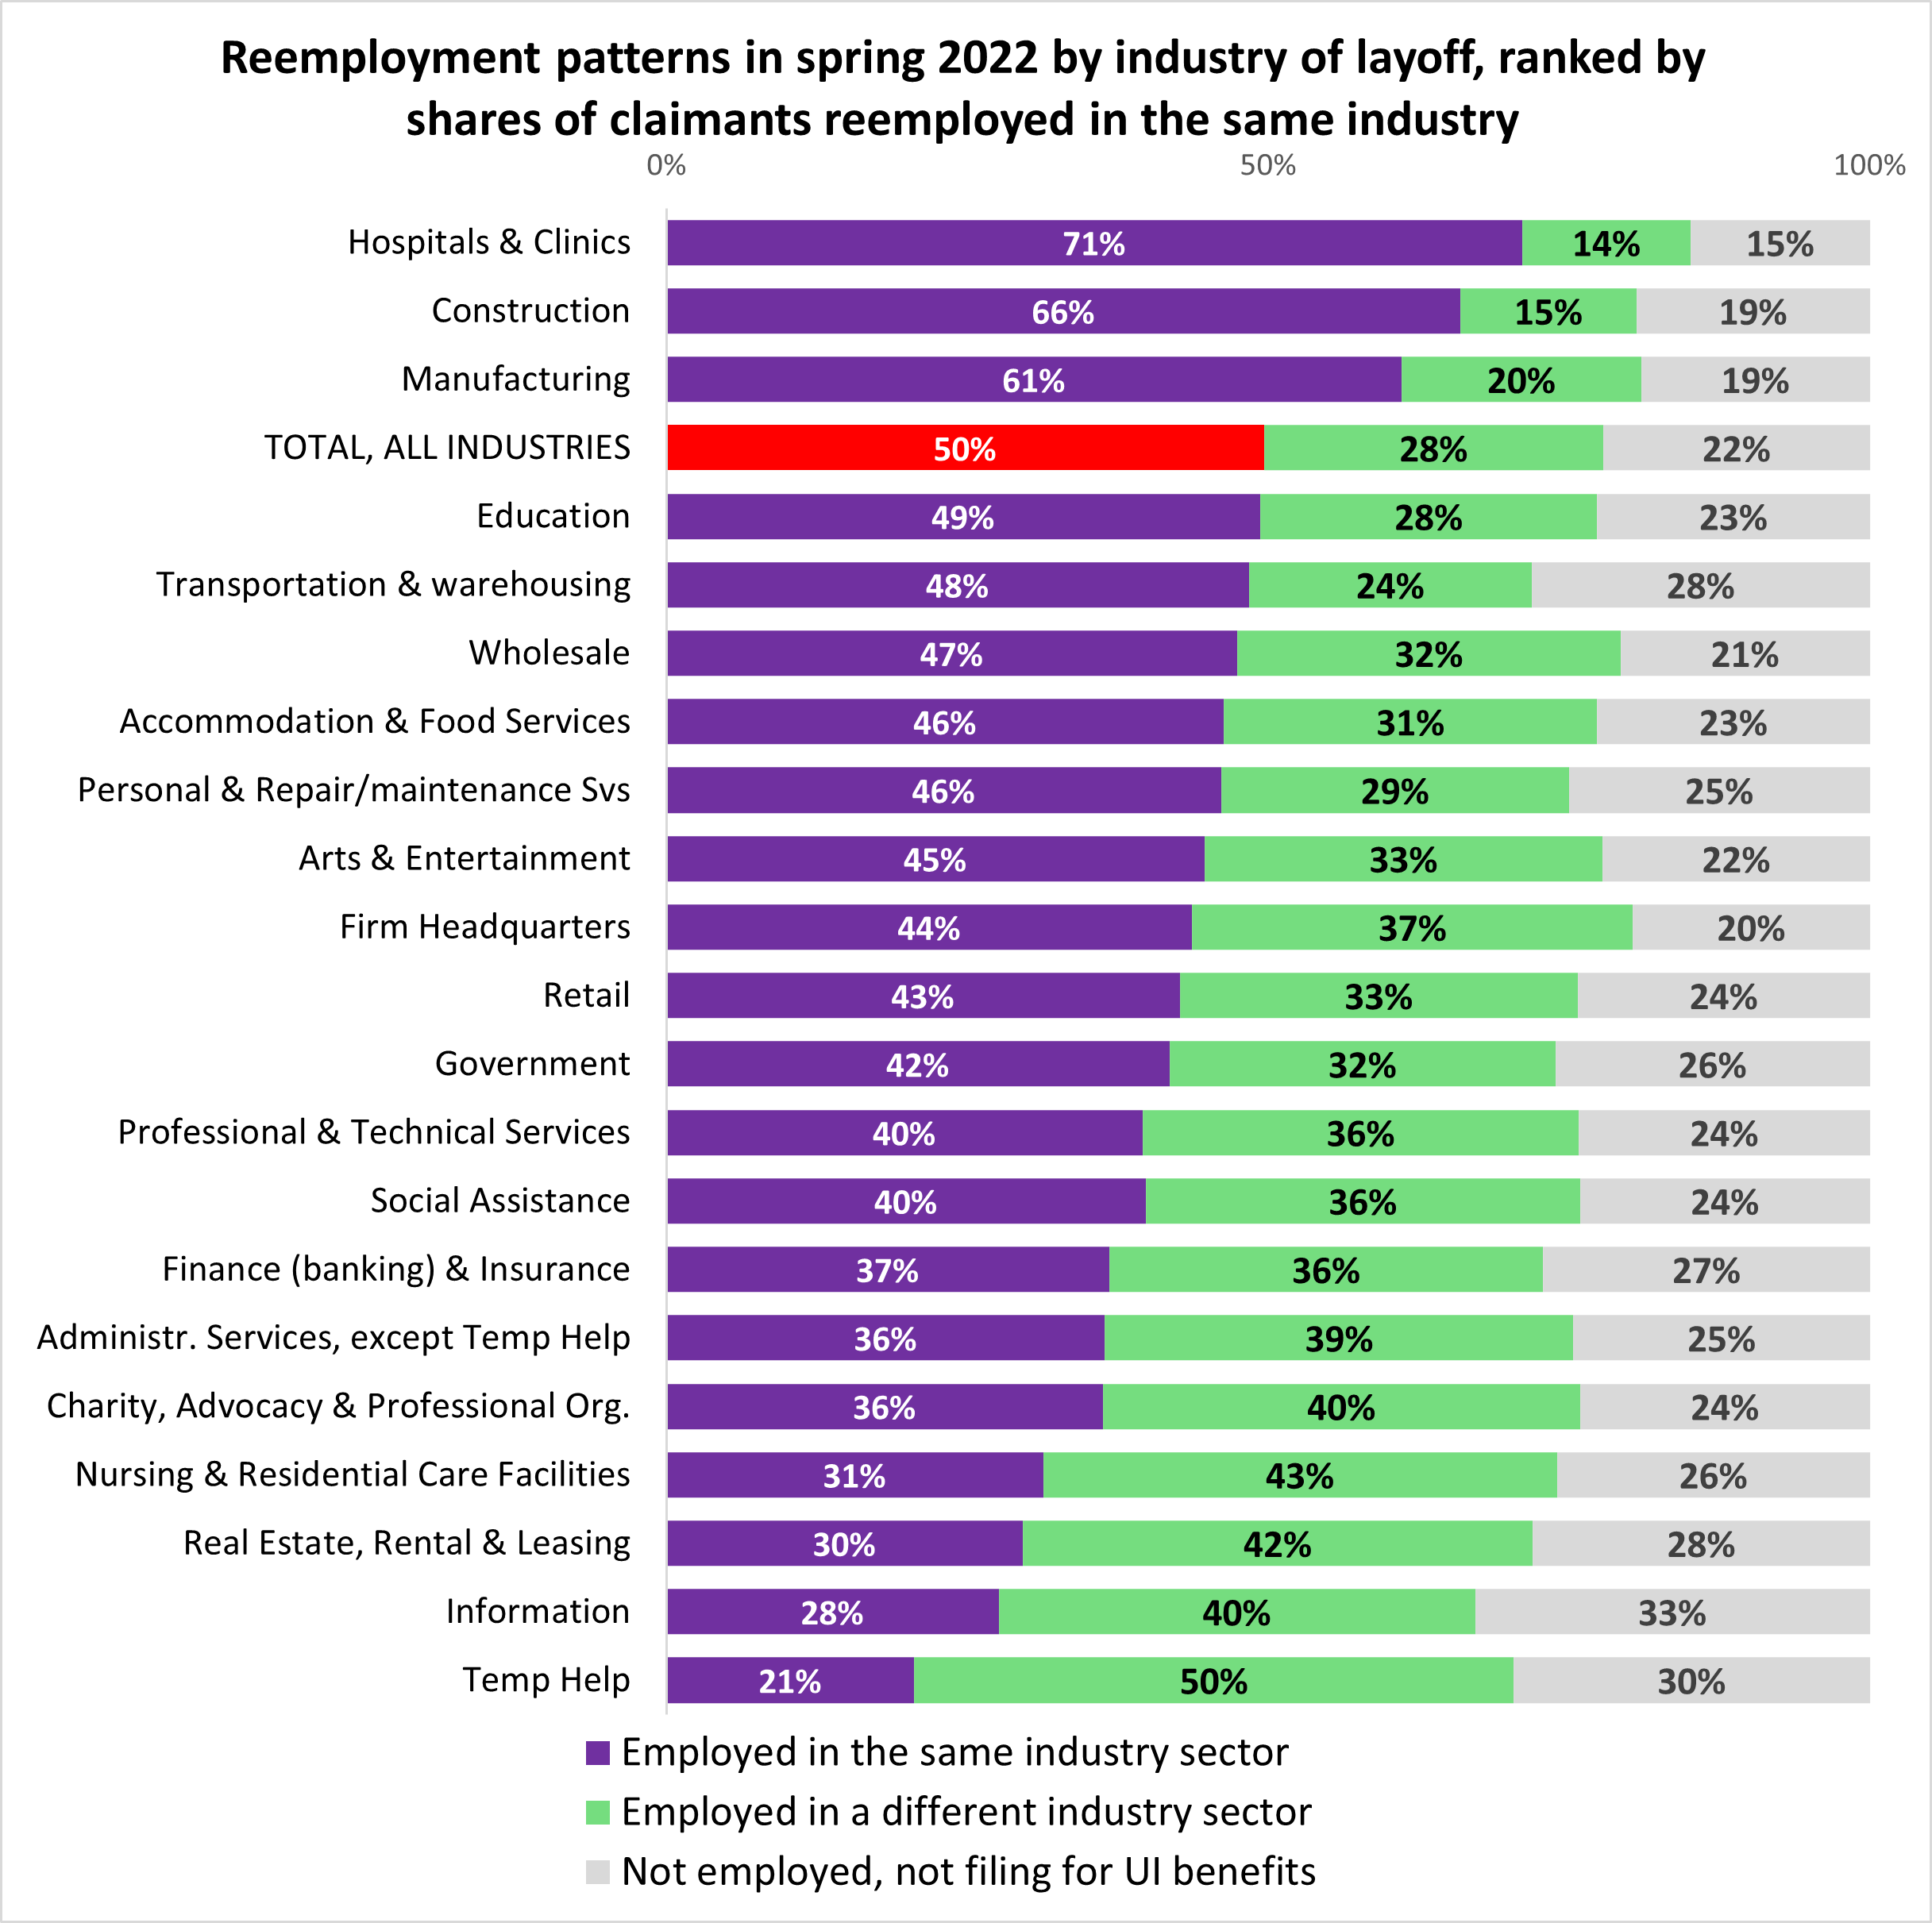
Green bars are larger when more workers sought and were able to find jobs outside the industry of origin. This is not surprising in Temp Help, where the half that switched industries were likely looking for more permanent work contracts. The share of switchers is also large in female-dominated sectors, such as Charity & Advocacy Organizations (40%), Nursing & Residential Care Facilities (43%), Real Estate, Rental & Leasing (42%), and Social Assistance (36%). The higher-than-average industry mobility of women in the post-COVID labor market, documented in Figure 6, is driven by these sectors, which could hemorrhage even more workers if employers do not take action to make these jobs more attractive.
It is also worth noting that the impact of the Pandemic Recession was extremely uneven within the health care sector, which we split into two components: Hospitals & Clinics had the highest shares of returning claimants (71%), while Nursing & Residential Care Facilities had one of the lowest shares (31%). Nursing & Residential Care Facilities has always been characterized by high turnover, but the pandemic appears to have exacerbated the phenomenon.
Which sectors gained the most from these shifts? The sector that absorbed the largest share of switchers – 11% – was Retail, followed by Manufacturing and Hospitals & Clinics. These sectors emerged stronger from the pandemic and were able to lure workers with flexible work hours and/or higher wages. Accommodations & Food Services also absorbed a relatively high share of claimants from other sectors (6.7%) thanks to rising wage offers for new hires as a way of attracting candidates5.
Which groups of claimants suffered the greatest wage losses after layoff? Did claimants who returned and continued to work with the employer who laid them off benefit from their greater job stability and longer tenure? Table 1 shows real (inflation-adjusted) earnings outcomes in second quarter 2022. Claimants who returned to and remained with the same employer (Group 1) were relatively older on average than other claimants (43 years) and, at least in part thanks to longer work experience, had the highest median wages pre- and post-layoff. Higher wages in their original jobs likely encouraged these workers to remain loyal to their employer during the economic recovery. However, the typical (median) claimant in this group experienced slightly negative wage growth (-0.4%). In other words, half of returning claimants experienced a wage loss of -0.4% or greater. The reason for these wage losses is not pay cuts or changes in job role but wage erosion from inflation. As shown in the last column, 20.4% suffered a loss greater than 10% of their pre-pandemic wage.
Table 1
| Reemployment Categories | Number of workers | Average age at time of layoff | Median real wage pre-layoff | Median percent change in real wages from pre-layoff to 2nd quarter 2022 | % workers whose hourly wages fell by >10% in 2 years |
|---|---|---|---|---|---|
| Returned and stayed with the same employer of layoff (Group 1) | 227,989 | 43 | $26.49 | -0.4% | 20.4% |
| Changed employer within same industry sector (Group 2) | 81,882 | 38 | $23.59 | 3.4% | 24.8% |
| Changed employer and industry sector (Group 3) | 176,493 | 35 | $19.54 | 6.8% | 28.1% |
| TOTAL claimants employed in quarter 2 2022 | 486,364 | 40 | $23.10 | 2.0% | 23.9% |
By contrast, workers who could not return to their original employer, or returned for a while and then decided to switch (Group 2) were younger and with lower wages at the time of layoff relative to Group 1. In part as a result of lower initial wages, the typical (median) claimant in this group experienced positive real wage growth at 3.4%.
Those who changed both employer and industry sector (Group 3) had the most favorable earnings growth outcomes, with a median wage growth of 6.8% over two years. These workers also had the lowest starting wages, which increases the chances of posting a wage gain two years after. Higher real wage growth for switchers relative to stayers is also a consequence of the fact that wages have grown faster for new hires than for incumbent workers, as documented in this job mobility study.
However, this positive result for Group 3 masks significant differences in outcomes, as shown by the high share (28.1%) of workers who experienced a wage loss greater than 10% of their pre-pandemic wage. This seemingly contradictory finding stems from the fact that there is more variability in outcomes for people who changed employers. For example, some workers might have seen a spike in wages because they obtained a hiring bonus in their new job, while others were forced to take a pay cut because their employer went out of business. Age is also a factor driving the risk of wage losses. Workers over 40 were more likely to suffer a pay cut when changing employer. Ageism may have played a role by inducing employers to favor job applicants who graduated recently from college with the idea that they will have the most updated skills.
These dynamics might lead to a future increase in job mobility among the young, fueling the Great Resignation phenomenon, accompanied by an increase in the share of older workers leaving the workforce altogether.
Were the wage outcomes shown in Table 2 mild or severe? To answer this question, we must compare the population of claimants to the total Minnesota workforce during the same time period (Table 2). Claimants experienced a median real wage growth of 2%, higher than the 1.4% experienced by the overall workforce. This is great news for workers impacted by layoffs and their families.
Table 2
| Reemployment Categories | Number | Median percent change in real hourly wages from pre-layoff to q2 2022 | Percent workers whose real hourly wages fell by >10% in 2 years |
|---|---|---|---|
| Claimants employed in 2nd quarter 2022 (Group 1, 2, and 3) | 486,364 | 2.0% | 23.9% |
| Total workforce employed in 2nd quarter 2022 | 2,394,249 | 1.4% | 23.6% |
As explained previously, this result is a function of the fact that wage erosion from inflation affected incumbent workers more than job switchers, and job switchers were more prevalent among claimants. Another indicator of the mild impact of the Pandemic Recession on claimants is the nearly identical share relative to the total workforce (23.9% versus 23.6%) of individuals who experienced real wage losses greater than 10%.
As mentioned previously, it's hard to know why 22% of claimants were not found in Minnesota's payroll records in second quarter 2022. An interesting subgroup to examine are those among them who appeared in payroll records in the second half of 2021 and were more likely to be still in Minnesota in 2022. These individuals had the following characteristics:
Weak attachment to the labor force, combined with low wages that do not keep up with inflation, might have discouraged some from returning to work in second quarter 2022. If the cost of being employed is high, in the form of rising transportation or child care costs, and the returns to work experience are low, as in the case of temporary jobs with no opportunity for training or advancement, the incentive to stay employed is more likely to be low. Other barriers such as poor health, disability6, and low education might have played a role in keeping these workers on the fence or involuntarily out of work.
Identifying and addressing the barriers that keep workers from moving out of low wage, unskilled work is imperative to the goal of increasing labor force participation to ease labor force shortages in the future.
Two years after the Pandemic Recession, the Minnesota labor market was strong enough to reemploy three out of four (77%) UI claimants who were laid off in the initial months of the pandemic. Despite this overall positive news, the study paints a picture of a two-tiered recovery, both from the point of view of impacted workers and impacted industry sectors. Key findings are summarized below:
This evidence shows that Minnesota avoided the phenomenon of prolonged unemployment with widespread income losses, which was so devastating in the aftermath of the Great Recession. However, barriers to reentry and to stable reemployment persist in certain segments of the workforce, keeping labor supply from meeting demand. To prevent the pool of available workers from shrinking further, it is imperative for employers to take action to make their jobs more attractive, improve retention and increase racial, disability status and age diversity in hiring.
1This is counting only workers applying from UI covered jobs. It does not include self-employed and gig workers who cannot be tracked in UI wage records. Other criteria for inclusion in this analysis is having filed a continuing (certified) claim, being age 18-75, being a Minnesota resident, and being employed in any of the three quarters preceding the start of the pandemic. These criteria are designed to avoid capturing individuals who filed fraudulent claims or were self-employed.
2According to SLEDS, 20% of Minnesota students in the 2021 high school graduation cohort subsequently enrolled in postsecondary institutions located out of state. As shown in this recent study, college-age workers are the most mobile in terms of switching employer, industry, and location of work including relocating out of state.
3As shown in this study, women were also slightly more likely to switch employer than men between first quarter 2021 to first quarter 2022 because they gained more from switching in terms of wage growth.
4Claimants laid off from the Information sector and not yet reemployed in spring 2022 were predominantly working in these occupations when they were laid off in second quarter 2020. Source: MN PROMIS database.
5Accommodation & Food Services is one of the few sectors where employers adjusted wages upwards for both new hires and incumbent workers. See figure 8.
6Disability status is a variable in the PROMIS database. The reemployment rate among claimants with a disability was 66%, way lower than the overall rate of 77%.