By Dave Senf
June 2021
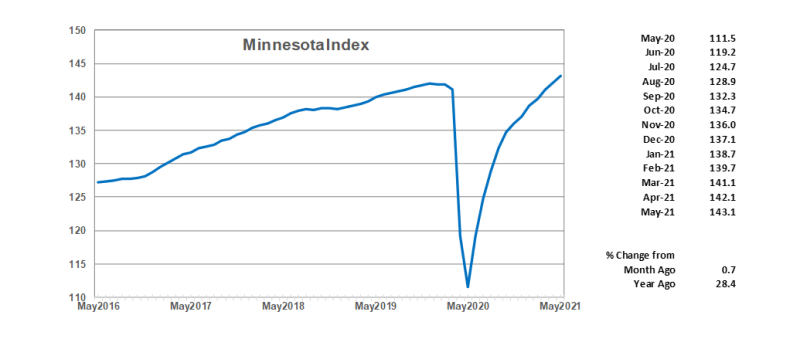
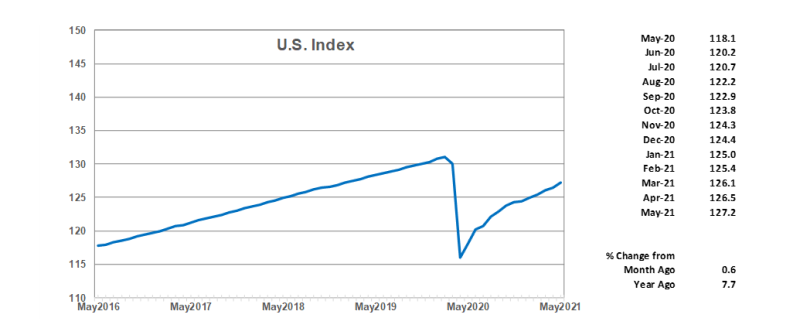
The Minnesota Index rose for the 12th month in a row in May, advancing 0.7% for the second consecutive month to 143.1. May's reading once again sets a record high. The index is a proxy for monthly GDP or economic activity, and May's robust level indicates that the value of Minnesota's economic activity has never been higher. Estimated U.S. GDP for the second quarter of 2021, when released in July, is expected to show that U.S. GDP also topped pre-pandemic level in the second quarter. Higher vaccination rates have all but eliminated most business restrictions boosting Minnesota economic growth. The U.S. Index increased 0.7% in May.
The Minnesota Index, a coincident index, combines four state-level indicators to summarize current economic conditions in a single statistic which is sort of a proxy for monthly GDP. The four state-level variables in the coincident index are nonfarm payroll employment, average hours worked in manufacturing by production workers, the unemployment rate, and wage and salary disbursements deflated by the consumer price index. The Minnesota Index, along with similar indices for all 50 states, is produced by the Philadelphia Federal Reserve Bank.
The Minnesota Index was up 0.9% compared to February 2020, the month before the Pandemic recession started. Minnesota was one of 13 states where the May 2021 reading was above the February 2020 reading. Minnesota ranked ninth among the 13 states with GDP, as measured by the indices, that was larger in May 2021 than last February. Utah (3.9%), Idaho (2.8%), Montana (2.3%), and South Dakota (2.0%) had the highest GDP growth over the period. Hawaii (10.5%), West Virginia (10.0%), and Nevada (9.1%) had the largest gaps in GDP compared to last February. May's readings for Minnesota's other neighboring states were all below last February's level with Wisconsin 0.3% below, Iowa 1.7% below, and North Dakota 4.0% below.
May's climb by the Minnesota Index was powered by three of the four components. Wage and salary employment (nonfarm payroll employment) and real wage and salary disbursements rose, and the state's unemployment rate fell to 4.0% in May from 4.1% in the previous month. Unemployment in Minnesota has now tailed off 12 straight months. Employees are still experiencing hurdles in filling their job openings which is slowing Minnesota's economic rebound. The labor force remains significantly below pre-pandemic (2.8% below February 2020 level) but is slowly growing as sidelined workers gradually return to the labor force.
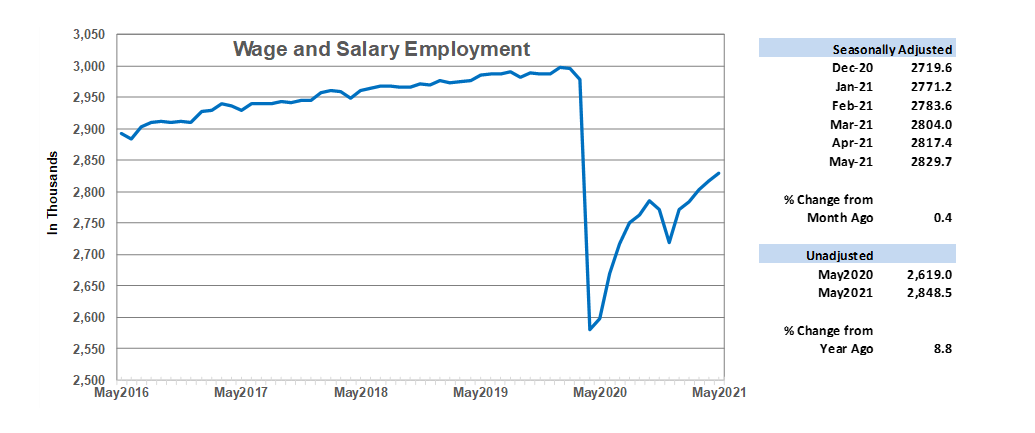
Wage and Salary Employment rose for the fifth straight month in May with jobs increasing by 12,300 in May following a revised April gain of 13,400. May's job jump was the smallest monthly gain this year right behind the 12,400 jobs added in February. The 0.4% monthly job gain in Minnesota match the U.S. monthly percent increase. Minnesota's seasonally adjusted employment has grown 4.1 percent since December 2020 or more than twice the 1.8 percent national employment gain over the same period. Minnesota's employers have added 110,100 jobs during the first five months of the year despite difficulties filling their booming job openings. As of May, the state has recovers roughly 60% of the 416,000 jobs lost during the pandemic. Nationally 65.9% of the 22.4 million jobs lost across the nation last March and April have been recovered as of May.
Private sector employers added 14,800 jobs while public sector employment dropped 2,500. The decline in public payrolls was concentrated in local government. Most of May's private job expansion was in Leisure and Hospitality, Professional and Business Services, Educational and Health Services, Other Private Services, and Construction. Trade, Transportation, and Utilities was the only private sector to record substantial job reduction.
May's unadjusted over-the-year change was 8.8% which was just a tad under the 9.0% nationally. Seasonally adjusted unemployment dipped to 4.0% in Minnesota in May while the U.S. unemployment rate dropped to 5.8%.
Minnesota's 8.8% over-the-year increase in unadjusted employment was the 17th highest. Nevada (19.4%) and Michigan (16.7%) hade the highest annual increases, while Wyoming (3.8%) and D.C. (3.6%) had the lowest annual increases. Wisconsin (8.0%) had the highest rate among neighboring states with South Dakota 7.0%), Iowa (6.7%), and North Dakota (5.4%) lagging behind.
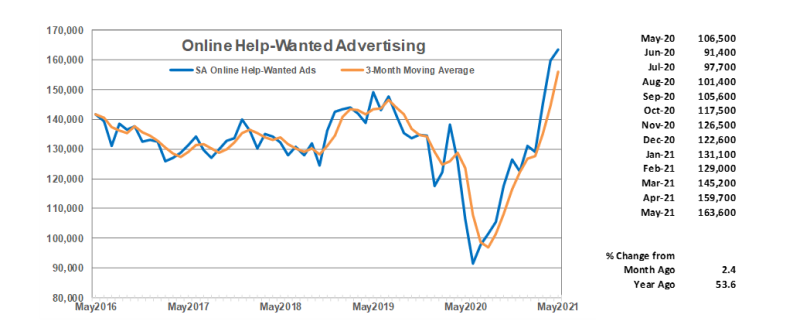
Online Help-Wanted Ads continued to advance in May, climbing 2.4% to 163,600 and setting a record-high for the second month in a row. Demand for workers was even stronger nationally as U.S. online job postings jumped 7.9% in May which was also an all-time high. Help-wanted ads posted online by Minnesota employers in May were 55% above the average monthly level recorded during 16 years of data. Nationally online help-wanted ads were 71% higher than the historical monthly average. Minnesota's share of U.S. online job inched down to 2.2% but remained slightly higher than the 2.0% share for national employment accounted for by Minnesota in May.
Minnesota's Purchasing Managers' Index (PMI) dipped slightly in May to 74.5. May's reading, however, was the fifth highest over the 27 years of the series, indicating that Minnesota manufacturers remain highly optimistic about expanding factory activity over the next six months. The employment component of the index rose to 67.2 from 60.2 last month, indicating that factory employment hiring is expected to accelerate into fall.
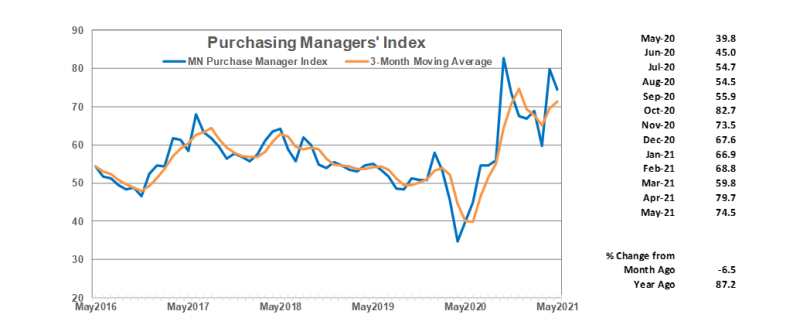
The national ISM Manufacturing Index ticked up to 61.2 from 60.7 while the Mid-America Business Index (nine states including Minnesota) slipped to 72.3 from 73.9. Based on the three readings Minnesota manufacturers are expecting to expand production at a faster rate relative to recent production levels compared to their counterparts in most other states. Minnesota manufacturers are, at least in May, more optimistic about how fast factory activity will pick up than their counterparts across the nation.
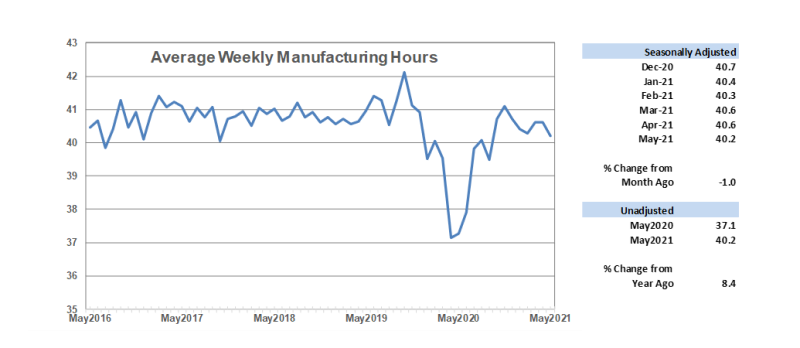
Average weekly Manufacturing Hours tailed off in May to 40.2 hours. The waning factory workweek doesn't line up with other manufacturing indicators which are pointing towards a pickup in manufacturing activity. Manufacturers have added workers for three straight months now, but payroll numbers continue to be below the February 2020 level. As of May, manufacturing employment is 4% or 12,900 jobs below February 2020.
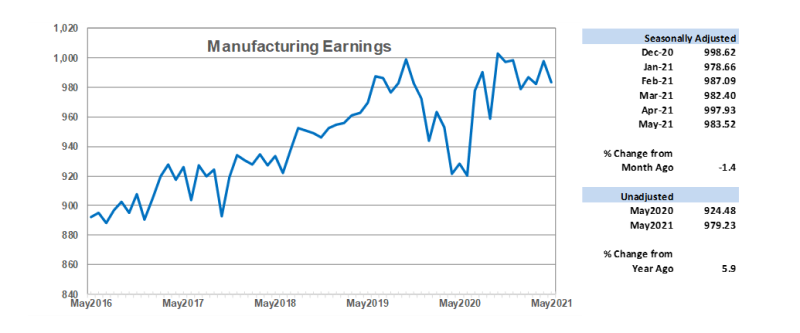
Seasonally adjusted average weekly Manufacturing Earnings, adjusted for inflation, inched down 1.4% in May to $983.52. Factory paychecks are back to pre-pandemic levels but have flatten out over the last six months which is counter to the story that manufacturers are having a hard time finding workers. Unadjusted factory paychecks were up 5.9% from last year in real terms in Minnesota and 5.3% nationally.
Adjusted Residential Building Permits, a proxy for future home building construction, jumped 20.6% in May to 3,479. That was the highest monthly total since August 2018. Median home prices continue to set record highs each month as home-builders scramble to meet demand. Low mortgage rates and the swelling number of millennials reaching their peak age for first-time home buying has driven robust home demand.
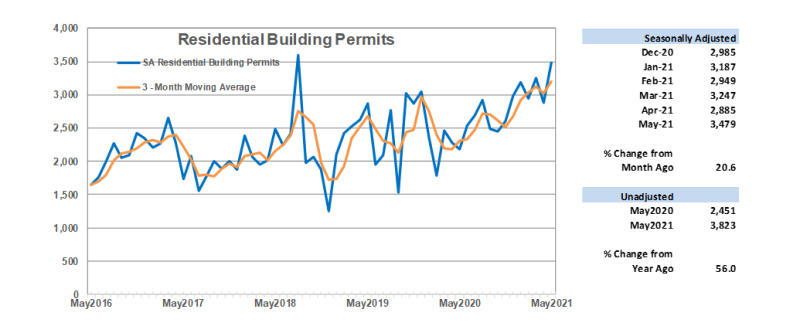
Minnesota accounted for 2.6% of home building permits issued nationwide in May, which is higher than the state's 1.7% share of U.S. population. Minnesota accounted for 1.9% of single-family permits but 4.9% of multiple-unit permits. Home-building permits through May are up 52% from a last year, a good indicator that 2021 will likely be the best year for the home-building industry since the booming years of the mid-2000s.
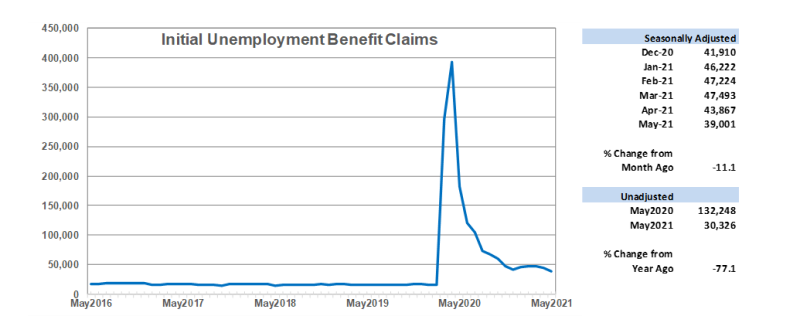
Adjusted Initial Claims for Unemployment Benefits (UB) declined for the second month in a row, dipping to 39,001. Unadjusted jobless claims are down 77.13% from last May but applications for initial unemployment benefits remain frustratingly above pre-pandemic levels even as hiring picks up. May's 39,001 claims are more than double the 15,432 claims in May 2019. Minnesota benefit filings, a proxy for layoffs, have receded as businesses return to fuller operations, but staffing level adjustment from changes in goods and services demand related to the pandemic continue to generate above normal layoff rates.
Note: All data except Minnesota's PMI have been seasonally adjusted. See the feature article in the Minnesota Employment Review, June 2010, for more information on the Minnesota Index.
The Philadelphia Federal Reserve Bank, which produces the Minnesota Leading Index, has temporary suspended generation of state leading indices.