by Dave Senf
November 2020
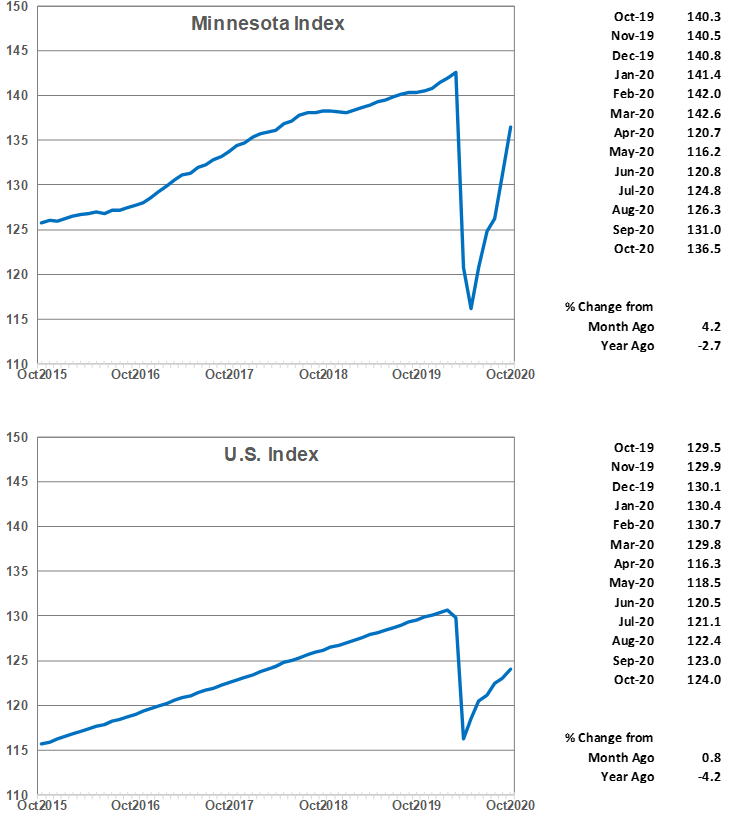
The Minnesota Index recorded its largest percent monthly gain ever in October, advancing 4.2% to 136.5. Minnesota’s index increased more than the U.S. index, which increased 0.8% in November, for the fifth straight month. The index which is a proxy for monthly economic activity in normal times may, however, be giving a more optimistic reading of Minnesota’s economic activity than warranted. One of the four main components of the index is the state’s unemployment rate. The unemployment rate dropped again in October, falling to 4.6% from 5.9% in September. Usually falling unemployment rates are associated with an expanding economy as hiring ramps up and the number of unemployed workers declines. Minnesota’s declining unemployment rate over the last two months has, however, been caused solely by a shrinking labor force. A declining labor force is not a sign of robust economic growth. The Minnesota Index’s usefulness as a gauge of economic activity in the state may be limited until the labor market recovers more from the pandemic effects.
The other three components of the index showed more certain evidence of economic rebound as wage and salary employment was up, average weekly manufacturing hours increased, and wage and salary disbursements rose. Minnesota’s economic rebound continued in October, just not at the robust rate suggested by the Minnesota Index.
Minnesota’s index is down 2.7% from a year ago while the U.S. index is down 4.2% over the year. The Minnesota Index is still 4.3% lower than its peak in March while the U.S. index is 5.1% behind its peak reached in February. Based on state coincident indices (which is what the Minnesota Index is) five states – Utah, Nebraska, Arkansas, Georgia, and Missouri – had a higher GDP in October than in March before the pandemic took hold. Minnesota has the 26th largest GDP gap for the same period. Hawaii and Maryland had the widest March to October gaps at 31.1% and 14.5%. Iowa’s economy was 2.0% below its March level, while South Dakota was 6.7% lower, Wisconsin 6.9% lower, and North Dakota 10.3% lower.
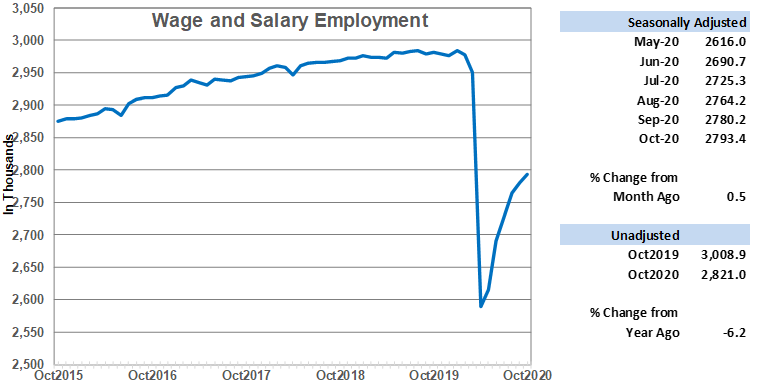
Adjusted Wage and Salary Employment climbed for the sixth consecutive month, but the pace of job growth slowed again. The 0.5% increase in October, the smallest percent increase over the last six months, added 13,200 jobs compared to 16,000 the previous month. After outpacing nationwide job growth in the previous two months, Minnesota’s job growth in October matched the national rate. The state has recovered roughly 52.1% of the 387,800 jobs lost in March and April over the last six months while nationally 54.4% of jobs lost in March and April have been recovered.
The private sector accounted for nearly all job expansion in October as private payroll numbers increased by 12,900 while public payroll numbers inched up by 300. All private sectors except for Information and Professional and Business Services expanded their workforce. Trade, Transportation, and Utilities along with Leisure and Hospitality added the most jobs. Hiring was also strong in Manufacturing and Other Private Services. Job cutbacks were highest in Professional and Business Services. The Goods-producing sector lost 34,200 jobs in March and April and has added 18,000 jobs since or 55% of jobs lost. Service-providing sector employment plunged by 353,000 jobs in March and April and has added 184,800 since or 52.3% of jobs lost.
Minnesota’s unadjusted employment in October was down 6.2% or 187,900 jobs from a year ago. Unadjusted employment nationwide was down 6.0% over the year or roughly 9.1 million jobs. Idaho was the only state with more wage and salary employment in October 2020 than October 2019. Hawaii and New York had the highest year-over-year decline, 17.4% and 10.2%. Minnesota’s 6.2% annual drop off is the 21st largest. South Dakota’s over-the-year decline was 2.9%, Iowa (4.7%), North Dakota (6.6%), and Wisconsin (6.8%).
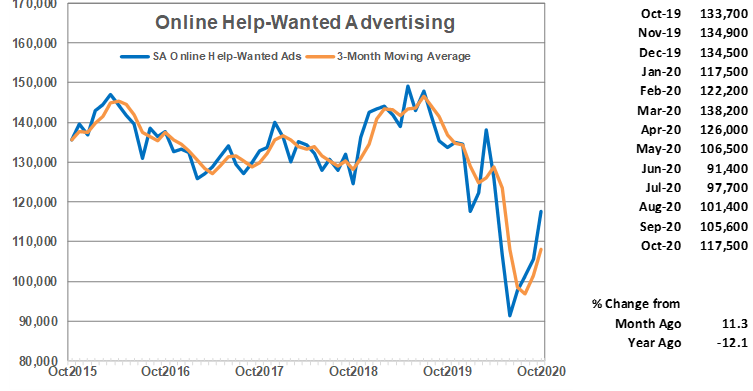
Online Help-Wanted Ads climbed for the fourth straight month to 117,500. The 11.3% jump was slightly higher than the nationwide 10.3% increase. Online help-wanted ads in Minnesota are down 15% from March compared to 13.4% for the U.S. Labor demand continues to run below levels prior to the pandemic in Minnesota and across most regions of the nation. Minnesota’s online job postings continue to account for roughly 2.2% of all U.S. job posting which is slightly higher than the 1.8% share of total nationwide payroll jobs accounted for by Minnesota in October.
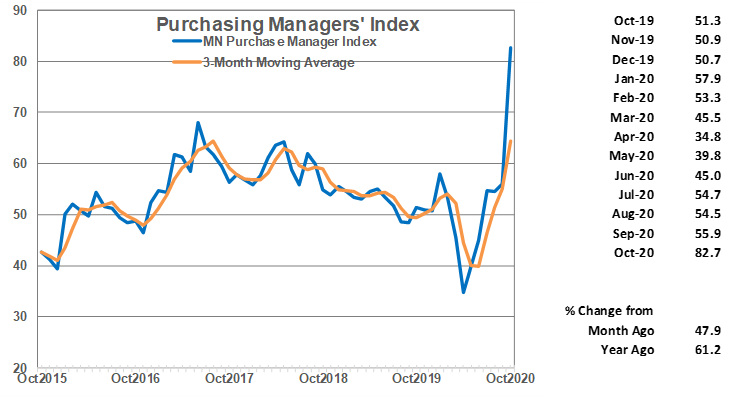
Minnesota’s Purchasing Managers’ Index (PMI) exploded in October spiking to its highest level ever – 82.7. The PMI is a composite index of survey responses from purchasing managers of manufacturing companies. Purchasing managers are ask if they expect production, inventories, employment, new orders, and delivery lead time to increase or decrease next month. They are not ask about the rates of increase or decrease, just whether increases or decreases are expected. The index ranges from 0 to 100 percent with a reading about 50% indicating expansion over the next few months.
Minnesota’s PMI raced past the national PMI (59.3) and the Mid-America Business Index (70.2) in October. Minnesota’s 82.7 reading suggests that Minnesota’s manufacturing activity will likely expand at a faster pace than nationally and those of the eight other Midwest states included in the Mid-America Business Index over the next few months.
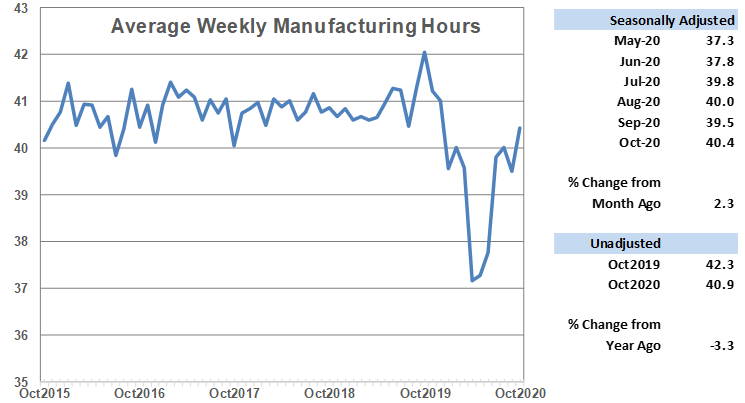
Average weekly Manufacturing Hours, after slipping for the first time since May, in September resume its upward trend in October, climbing to 40.4 hours. That’s is the longest factory workweek since last December. The increasing workweek is consistent with the jump in Minnesota’s PMI with both indicators pointing toward an acceleration in Minnesota’s manufacturing activity.
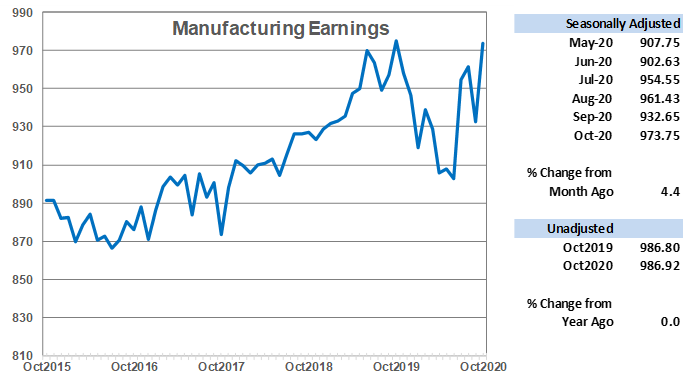
Average weekly Manufacturing Earnings, after dropping in September, stage a comeback in October, spiking up to $973.75. October’s average weekly paycheck was just below last October’s record-high weekly manufacturing earnings of $975.04. October’s high average weekly factory paycheck, similar to the rise in hours worked, implies that manufacturing activity in the state is gaining momentum.
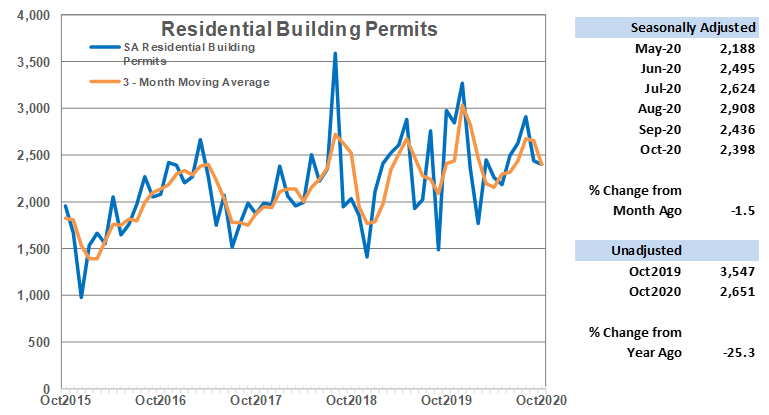
Adjusted Residential Building Permits inched down in October to 2,398. Despite the small decrease, home-building activity in Minnesota remains solid as the state again accounted for 2.2% of U.S. home-building permits in October. The 2.2% share of home-building permits is slightly higher than Minnesota’s `1.7% of U.S. population.
Home building permits totaled 24,555 through the first 10 months of the year which is just a tad above the 24,224 permits issued during the first 10 months last year. Home-building activity in the state in 2020 is likely to be the highest since 2005 despite the economic disruption of the ongoing pandemic. High demand for housing, in part from record low mortgage rates, has boosted home-building activity in the state right through the pandemic recession. This is the opposite of what usually happens during a recession.
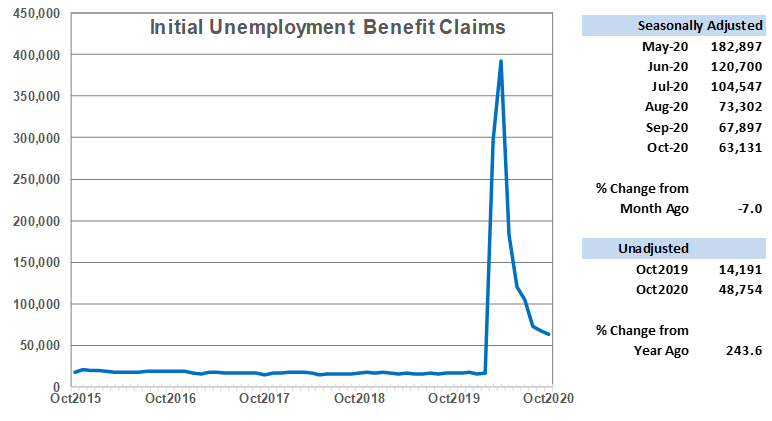
Adjusted Initial Claims for Unemployment Benefits (UB) declined for the sixth month in a row after spiking in March and April. The 7.0% decline in October was the smallest monthly decline over the six months of falling initial claims. Initial claims declined by a monthly average of 33% from May to August but only declined by a 7.2% average over the last two months. Workers continue to be laid off at rates significantly above pre-pandemic levels as initial claims in October were nearly four times higher than in February. The continuing elevated level of initial claims shows that the pandemic is still negatively impacting some businesses, resulting in layoffs and creating headwinds for faster job growth.
Note: All data except for Minnesota’s PMI have been seasonally adjusted. See the feature article in the Minnesota Employment Review, June 2010, for more information on the Minnesota Index.
The Philadelphia Federal Reserve Bank, which produces the Minnesota Leading Index, has temporary suspended generation of state leading indices.