by Cameron Macht
June 2019
A more diverse and older labor force brings new opportunities for employers and job seekers.
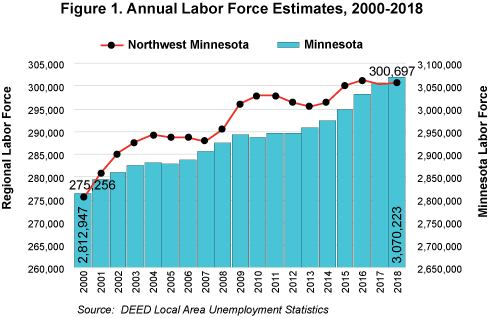
After adding 25,000 new workers since the turn of the century, the labor force in the 26-county Northwest region surpassed 300,000 workers in 2015, and has hovered right around that number ever since (Figure 1). The region’s growth rate of 9.2 percent since 2000 slightly outpaced the statewide increase of 9.1 percent, leaving Northwest with the second largest regional workforce outside the Twin Cities area.

While the region’s available labor force is still growing, the pace has slowed in recent decades. After averaging a gain of nearly 4,500 net new workers each year from 1990 through 2000, then just over 2,250 new workers annually in the 2000s, the region has added only 2,700 workers total from 2010 to 2018, an average of 339 workers per year.
Employers in Northwest have benefited from this deep talent pool over the past decades, but the aging population and slowing growth means that luxury is starting to dry up. What’s more, labor force projections from the Minnesota State Demographic Center show that the region is expected to see a decline in available workers in the next decade, dropping about 2.1 percent from 2020 to 2030. Even if participation rates increase for older workers, projections show it will still be a challenge to find workers to fill jobs.
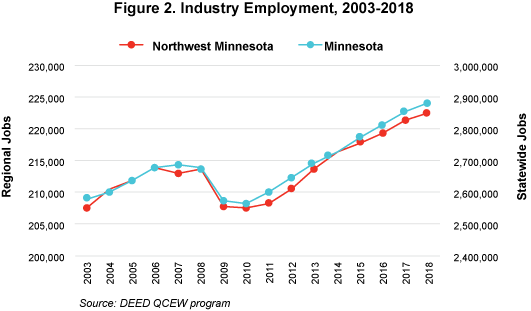
Northwest Minnesota has enjoyed eight straight years of job growth since bottoming out with about 207,500 jobs at employer establishments in 2010 at the end of the Great Recession. It is now at a new peak of almost 222,500 jobs in 2018 (Figure 2). Expanding just over 7 percent from 2010 to 2018, the region’s economy didn’t quite keep pace with the state’s 12 percent growth rate, but labor force availability has become a constraint for employers looking to expand even more.

A strong economy that added nearly 15,000 jobs compared with a workforce that added only 2,700 workers over the same time frame has led to a much tighter labor market. As evidence, the unemployment rate in the region dropped from a high of 8.2 percent in 2009 to just 3.8 percent in 2018, the lowest rate ever reported for Northwest Minnesota.
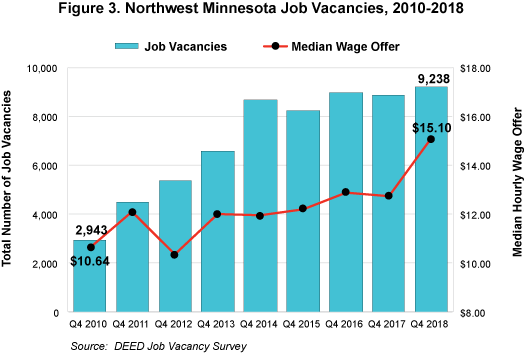
Likewise, recent Job Vacancy Survey results showed a record number of job openings in the region. Employers posted nearly 20 percent more jobs in 2018 than in 2017, the previous peak. There were just over 14,000 job vacancies in the second quarter of 2018, a 32 percent jump compared to the previous year; and over 9,000 vacancies in the fourth quarter of 2018. Both 2018 vacancy counts were triple the amount posted in 2010.
Increasing demand has led to increasing wages: The median wage offer topped $15 an hour for the first time in the fourth quarter of 2018. While that was a larger than expected jump, the wage trend line is very clearly pointing upward along with the number of job vacancies (Figure 3). It appears that employers are responding by raising wage offers – especially in lower-skilled, lower-paying jobs such as sales and related occupations and food preparation and serving occupations – to compete for available workers.

Moving forward, employers will need to start tapping into other pipelines to find the workers they need to fill available jobs. While 91.5 percent of people reported being White, the region has seen rapid increases in the number of people of other races. Almost half of the new residents in the region since the turn of the century are of a different race than White, and about one in every four new residents is of Hispanic or Latino origin (Table 1).
| Table 1. Northwest Minnesota Population by Race and Hispanic Origin, 2017 | ||||
|---|---|---|---|---|
| Number | Percent | Change from 2000-2017 | ||
| Numeric | Percent | |||
| Total Population | 560,326 | 100.0% | +33,534 | +6.4% |
| White | 512,783 | 91.5% | +18,310 | +3.7% |
| Black or African American | 5,809 | 1.0% | +4,363 | +301.7% |
| American Indian and Alaska Native | 22,900 | 4.1% | +3,726 | +19.4% |
| Asian and Other Pacific Islander | 3,973 | 0.7% | +1,555 | +64.3% |
| Some Other Race | 2,531 | 0.5% | -786 | -23.7% |
| Two or More Races | 12,330 | 2.2% | +6,366 | +106.7% |
| Hispanic or Latino Origin | 15,714 | 2.8% | +7,722 | +96.6% |
| Source: U.S. Census Bureau, 2013-2017 American Community Survey | ||||
With 22,900 people, Northwest Minnesota has the largest and is the fastest growing American Indian population of any region in the state. However, the labor force participation rate is much lower, and the unemployment rate is more than five times higher for American Indians in comparison to whites. Bringing the American Indian participation rate up to the white rate would add nearly 850 additional workers, while bringing the American Indian unemployment rate down to the white rate could fill 1,350 jobs without changing the size of the labor force at all.
The region's Hispanic or Latino population doubled since 2000, and Hispanic residents now account for almost 7,250 workers. These workers have contributed greatly to the region's labor force, with participation rates over 10 percent higher than for white workers, but unemployment rates that were 1.5 percent higher. The number of people of two or more races also doubled over the past decade and a half, providing growth to the labor force, despite higher unemployment rates.
The fastest upswing occurred for black or African Americans, following a 300 percent increase from 2000 to 2017. However, the region's black unemployment rate was 10.4 percent in 2017 – nearly three times higher than the white unemployment rate. Applying the region's white unemployment rate across all races would fill almost 1,700 jobs.
Minority students now make up nearly 20 percent of the region's total enrollment, after increasing more than 50 percent in the last decade. The number of white students increased just 2 percent during the same time frame. Enrollment data from the Minnesota Department of Education show larger numbers of minority students in the younger grade levels, meaning they will make up a larger portion of the region's workforce moving forward.
Employers who want to find workers will need to tap into new pipelines to fill their available jobs in the future. Even as labor force growth has slowed down, labor force diversity has picked up, creating new opportunities for job seekers and employers.