by Dave Senf
April 2018
Note: All data except for Minnesota’s PMI have been seasonally adjusted. See the feature article in the Minnesota Employment Review, May 2010, for more information on the Minnesota Index.
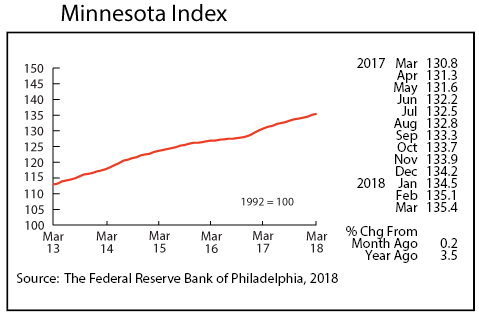
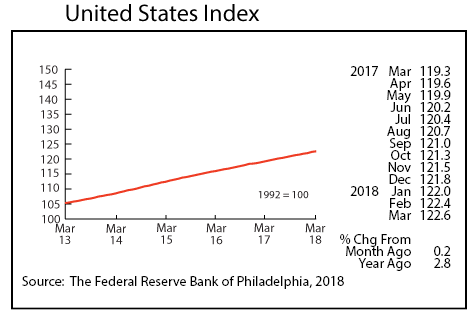
The Minnesota Index advanced for the 19th consecutive month in March but at a slower pace than in February. The index climbed 0.2 percent in March, matching the gain in the U.S. Index. The Minnesota Index’s advance was fueled by an increases in wage and salary employment and wage and salary disbursements. The index’s two other components – the unemployment rate and average weekly manufacturing hours – held steady in March. Minnesota’s index was up 3.5 percent overtopping the 2.8 percent jump for the national index.
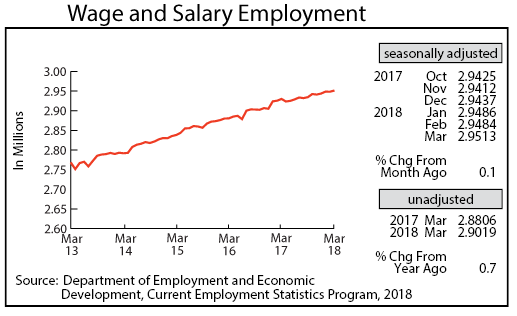
Minnesota’s adjusted Wage and Salary Employment grew 2,900 jobs in March, following a 200 decline in February. The state has added 7,600 jobs since the beginning of the year. All of the job gain was in the private sector as government payrolls dropped by 100 positions. Goods-producing sectors added jobs for the seventh straight month which hasn’t happened since early 2015. Hiring was strong in Trade, Transportation, and Utilities and in Manufacturing. Job cuts were largest in Other Services and Construction.
Minnesota’s unadjusted over-the-year job growth inched down 0.7 percent or more than half as slowly as the 1.6 percent over-the-year job growth achieved nationally. Minnesota’s relatively low rate of job growth may just be a product of the state’s tightening labor market rather than from waning labor demand.
.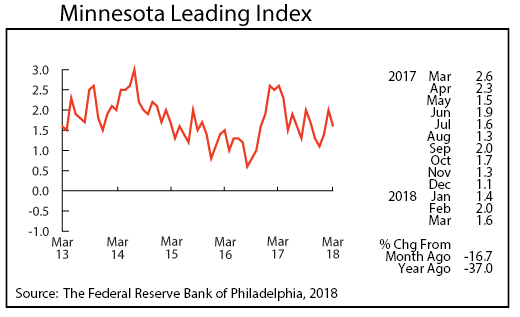
The Minnesota Leading Index dipped in March to 1.6 which is just above the 1.5 average over the 36 years of data for the index. The solid reading implies that the Minnesota Index will advance by 1.6 percent over the next six months. The Minnesota Index is a monthly proxy for the state’s GDP.
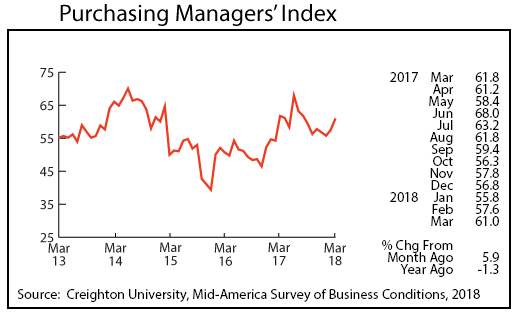
Minnesota’s Purchasing Managers’ Index (PMI) jumped for the second month in a row, advancing to 61.0, the highest reading since last August. The solid index suggests that Minnesota’s manufacturing activity will be expanding at a robust rate through the summer. Minnesota manufacturers expanded their workforce by 3,100 over the last two months. That is the highest two-month gain since September/October of 2004. The corresponding national index tailed off to 59.3 in March while the Mid-American index, which includes Minnesota and eight other states, rose to 62.1.
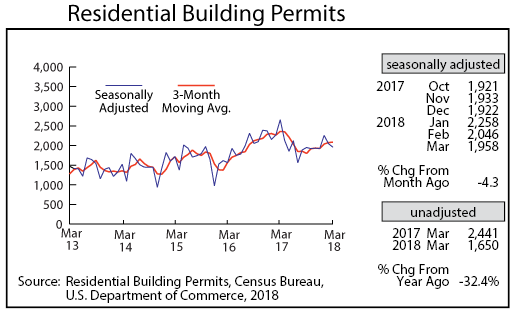
Adjusted Residential Building Permits, after topping 2,000 for the first two months of 2018, dipped to 1,958 in March. Home-building levels through the first three months of 2018 are down 31 percent from 2017.
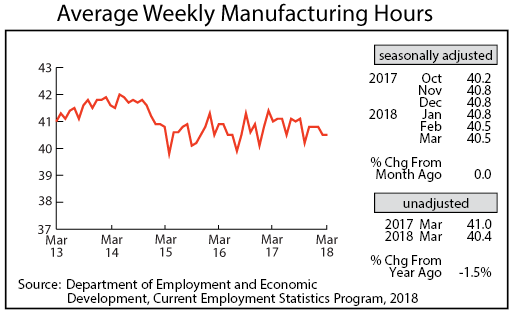
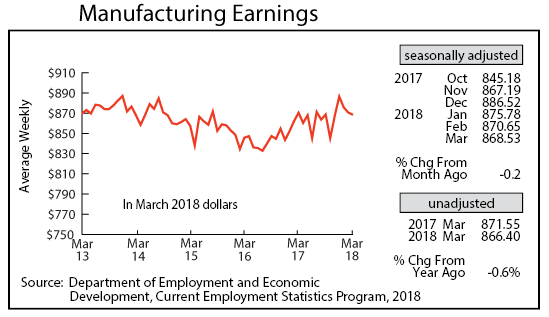
Adjusted average weekly Manufacturing Hours remained at 40.5 for the second month in a row in March. Weekly factory hours nationally averaged 42.2 in March. Since the industrial classification system was revised in 2001, Minnesota and U.S. weekly manufacturing hours have averaged 40.6 and 41.1 hours respectively. Average weekly Manufacturing Earnings tailed off for the third consecutive month in March to $868.52. Minnesota’s average factory paycheck last December was $886.52, the fourth-highest inflation-adjusted total over the 48 years of data. Factory paychecks, adjusted for inflation and seasonality, were less than a year ago for the first time in 14 months.
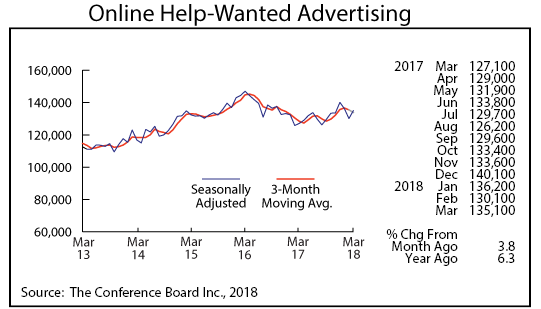
Online Help-Wanted Ads bounced back in March, rising to 135,100, the highest level for the year. Minnesota online job postings rose 3.8 percent in March while national postings increased 2.2 percent. The Conference Board, in addition to compiling and publishing online help-wanted ads, also publishes a supply/demand ratio for each state comparing the number of unemployed workers to the number of online job postings.
The national rate was 1.42 or 1.42 unemployed workers for each online help-wanted ad in March. Twelve states had a ratio of one or below including Minnesota with a supply/demand ratio of 0.77. Only Hawaii, North Dakota, and Colorado had lower supply/demand ratios. Among the 52 largest metro areas, the Minneapolis-St. Paul metro area’s supply/demand ratio of 0.61 ranked second lowest behind San Jose. Minnesota employees increasingly are having trouble finding the workers they want to hire.
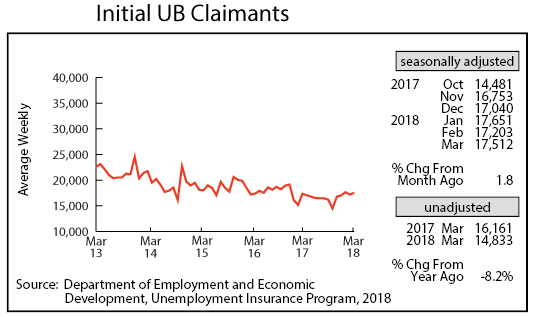
Adjusted Initial Claims for Unemployment Benefits (UB) climbed for the fourth time over the last five months in March to 17,512. Initial claim levels have been higher than a year ago since January. Initial claim levels were only higher than the previous year for one month in 2017. The recent uptick in initial claims, however, has been small, and claim levels remain low by historical standards. Initial claims have averaged roughly 10 for every 1,000 wage and salary jobs since 1970. March’s ratio, just under six initial claims per 1,000 jobs, was way below the historical average.