by Cameron Macht
December 2023
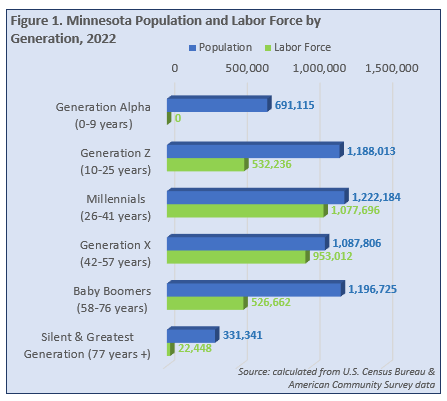
With a growing population exceeding 5.7 million people in 2022, there are now at least six generations living together in the state of Minnesota. Long the largest generation, the just under 1.2 million Baby Boomers are now second after being surpassed by Millennials with just over 1.2 million people; but are still slightly ahead of Generation Z with 1.19 million people and Generation X with about 1.1 million people. The youngest, Generation Alpha, already has nearly 700,000 people, while the two oldest generations – Silent and Greatest – have the smallest population with around 330,000 people (see Figure 1).

Consequently, there are now also at least five generations at work in Minnesota, ranging from teenagers in Generation Z to senior citizens from the Silent Generation. According to 2022 1-year estimates from the U.S. Census Bureau's American Community Survey, Millennials now make up the largest cohort in the labor force with just under 1.1 million workers, followed by Generation X with just over 950,000 workers. As the front end of the Baby Boom generation has reached retirement age, the number of Baby Boomers has dropped to around 525,000 workers. However, many people don't retire in their sixties; there are still about 22,500 from the Silent Generation, age 77 and older, working in Minnesota. Generation Z is still just entering the workforce, but already provides more than 530,000 workers, equal to the current Baby Boom workforce.
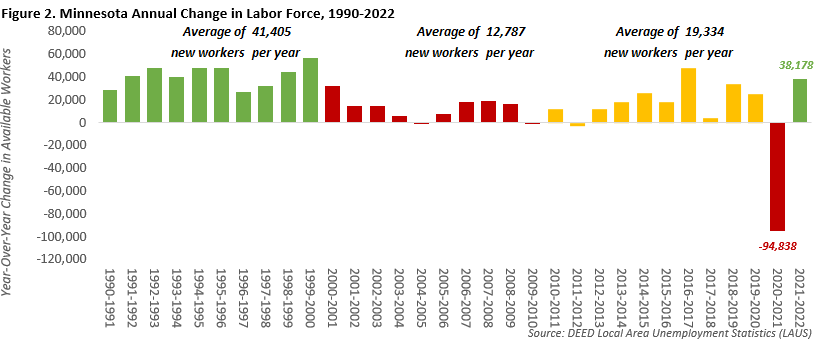
For decades, employers in Minnesota were able to tap into a deep talent pool that was rapidly growing through a steady stream of new workers. Local Area Unemployment Statistics show that Minnesota added nearly 415,000 net new workers in the 1990s, an average of more than 41,000 each year. Labor force growth slowed in the 2000s amidst two recessions, but still amounted to nearly 130,000 additional workers over the decade. The state gained about 195,000 net new workers from 2010 to 2020 amidst the longest running economic expansion in modern history (see Figure 2). However, starting in the late 2010s and continuing into the 2020s so far, employers in the state began producing more open jobs than there were available workers to fill them.
Minnesota surpassed 3 million workers on an annual average basis in 2015 and exceeded 3.1 million in 2019. Even while gaining about 19,500 workers per year in the 2010s, the tight labor market had become a constraint to faster economic growth in the state, as job vacancies reached record numbers in recent years. Then the Pandemic Recession in 2020 pushed an historic 95,000 workers out of the labor force in one year, due to many factors including short-term layoffs, child care responsibilities, early retirements and much more.

Nearly 40,000 workers came back into the labor market from 2021 to 2022 as the economy recovered, but job vacancies remained near historic highs. While annual data is not yet available for 2023, through the first 9 months the state is back above 3.1 million workers, and in September 2023, was only about 4,400 workers shy of the level in September 2019, prior to the pandemic. Minnesota recorded seven straight months of labor force growth through September 2023, as more people entered the workforce and found jobs in the growing economy.
According to population projections from the Minnesota State Demographic Center, the state is expected to gain nearly 261,500 new residents from 2025 to 2035, a 4.5% growth rate, which would push the state's population to just under 6.1 million people. At that point, the Silent Generation will be over 90 years of age. The youngest Baby Boomers will be 71, well past the traditional retirement age, while the oldest will be 89 years old. Generation X will be between 55 and 70 years, rapidly moving into retirement; while Millennials will be right in the middle of their prime working years, from 39 to 54. Generation Z will be fully into the labor force, from 23 to 38 years of age; and Generation Alpha will just be entering the workforce, including teenagers and young adults up to 22 years of age. And while it hasn't been named yet because it hasn't even been born yet, a new generation will also be started by 2035.
| Table 1. Minnesota Labor Force Projections, 2025-2035 | ||||
|---|---|---|---|---|
| Age | 2025 Labor Force Projection | 2035 Labor Force Projection | 2025-2035 Change | |
| Numeric | Percent | |||
| 16 to 19 years | 165,227 | 162,233 | -2,994 | -1.8% |
| 20 to 24 years | 302,995 | 324,524 | +21,530 | +7.1% |
| 25 to 44 years | 1,362,824 | 1,392,696 | +29,871 | +2.2% |
| 45 to 54 years | 590,842 | 692,246 | +101,404 | +17.2% |
| 55 to 64 years | 515,086 | 466,596 | -48,490 | -9.4% |
| 65 to 74 years | 175,925 | 169,259 | -6,666 | -3.8% |
| 75 years & over | 28,636 | 38,831 | +10,195 | +35.6% |
| Total Labor Force | 3,141,536 | 3,246,386 | +104,850 | +3.3% |
| Source: calculated from Minnesota State Demographic Center population projections and 2017-2021 American Community Survey 5-Year Estimates | ||||
If the state's population changes at the rates projected by the State Demographic Center through 2035, applying current labor force participation rates by age group to future population projections by age group means the state would be expected to see a continued, but slower, expansion in the labor force over the next decade. If participation rates stay the same, the state would gain around 105,000 new workers from 2025 to 2035, a 3.3% increase (see Table 1). That would be an average of just under 10,500 new workers per year.
Aside from an overall increase, the age structure of the labor force is also projected to shift over time, with gains in the number of workers age 20 to 54 and 75 years and older against a small decline in the number of workers age 16 to 19 and a much more notable loss of workers from 55 to 74 years. This reflects the size differential between the Baby Boom and Generation X, but also the considerable magnitude of Millennials and Generation Z. In step with current trends, the shifting age structure will lead to a continuing tight labor market in the future.
Moving forward, data helps show how two groups of "seniors" will have a huge impact on Minnesota's economy. In past decades, the state has always had far more 12th graders than people turning 65. For example, a decade ago (in 2012) there were approximately 44,100 people aged 65 in Minnesota, compared to about 76,600 12th graders, meaning there were about 32,500 more people ready to enter the labor force as were potentially ready to leave it.
Table 2 shows that more recently, in 2022, there were about 81,700 12th graders compared to 65,000 67 year olds (the full retirement age for people born in 1960 or later1), meaning there were about 16,700 more students than prospective retirees. While this means there were still more people potentially ready to join the labor market than leave it, the gap was clearly narrowing – it was essentially cut in half in just a decade.
Fast forward to the middle of Table 2, and the significance of the shifting demographic wave becomes more obvious. The tipping point occurs with the 7th grade class – they are outnumbered by nearly 3,300 by 62-year-olds, and for the next 5 years as well, the imbalance between students and adults continues, with the largest gaps between 5th and 6th graders and 60-and 61-year-olds. Obviously, a lot can change for both of those populations as they move through the age and grade cohorts, but if nothing does, the 2nd through 7th grade classes would leave a deficit of 26,380 more people reaching retirement age than graduating from high school.
However, as both groups move through the population pyramid, the balance eventually begins to shift back. According to the Census Bureau's student enrollment estimates, there were about 70,900 kindergarten students in the state in 2022, compared to 67,200 55-year-olds, so if nothing changed over 12 years, the state would again see slightly more people graduating than reaching retirement age in 2034.
| Table 2. Minnesota Population by Age & Student Enrollment by Grade Counts, 2022 | ||||
|---|---|---|---|---|
| Grade | Number | Age | Number | Number of Students Compared to Adults |
| Kindergarten | 70,877 | 55 years | 67,163 | +3,714 |
| 1st grade | 69,950 | 56 years | 68,700 | +1,250 |
| 2nd grade | 71,842 | 57 years | 72,163 | -321 |
| 3rd grade | 71,352 | 58 years | 74,986 | -3,634 |
| 4th grade | 71,447 | 59 years | 76,347 | -4,900 |
| 5th grade | 69,930 | 60 years | 77,474 | -7,544 |
| 6th grade | 71,326 | 61 years | 78,026 | -6,700 |
| 7th grade | 72,920 | 62 years | 76,201 | -3,281 |
| 8th grade | 74,580 | 63 years | 74,353 | +227 |
| 9th grade | 76,695 | 64 years | 73,147 | +3,548 |
| 10th grade | 75,848 | 65 years | 71,023 | +4,825 |
| 11th grade | 74,798 | 66 years | 67,065 | +7,733 |
| 12th grade | 81,689 | 67 years | 64,969 | +16,720 |
| All Grades | 953,254 | 55-67 years | 941,617 | +11,637 |
| Source: U.S. Census Bureau, 2022 American Community Survey, Minnesota Dept. of Education Student Enrollment,
2022 State Population by Characteristics |
||||
Together, both of these groups of "seniors" will impact the labor force and economy in Minnesota, leading to slowing labor force growth and changing needs for both employers and employees over the next decade.
1Social Security Administration Benefits Planner: Retirement.